Chapter 4 Approach
4.1 Human Subject Research
We have an approved IRB (#20-537) that outlines the minimal risk from the survey participants, and have a data plan for storage, anonymization, and sharing.
4.2 Introduction
While there is a lot of literature and studies on computer science education, very little is known about data literacy education, and even less on data science education. Since data science skills inherently involve programming (Dolgopolovas and Dagienė, 2021; Farrell and Carey, 2018; Song and Zhu, 2016), there are synergies between the educational and pedagogical approach to teaching data science, however, little is known about what key concepts are needed to engage into the larger data science process and what learning objectives that need to be taught, and the effectiveness of those learning objectives.
This work will create community-oriented, open, maintained, and focused data science learning materials for the medical and biomedical sciences. To this end, in Aim 1, we lay the groundwork for understanding potential learners by identifying and creating learner personas, fictional characters that represent a typical type of learner, by creating and validating a set of self-assessment surveys. In Aims 2 and 3, we create and assess the effectiveness of the learning materials, the workshop that teaches the materials, and the implementation of formative and summative assessment questions to see if learning objectives are met. As a collective whole, we will better understand the needs of our learners and create a data science curriculum that meets their needs while providing a solid data literacy foundation that can be used to continue learning (Farrell and Carey, 2018).
The long-term implications of this work are to bridge the skills gap between medical practitioners and domain experts in the biomedical sciences with the analysts, researchers, and data scientists to make better use of data (storage, FAIR, stewardship) in data science teams by creating and bolstering a computational community of practice that can enhance workforce development, modernize the data ecosystem, work with data science tools for sustainable and open science.
4.3 Hypothesis
Our central hypothesis is that learning materials with an eye towards the learner and tidy data principles is an effective way to teach the data science and data literacy skills that will help learners incorporate programming and data science skills from their spreadsheet workflows. Data science tools are built around inputs that are defined by tidy data principles. Spreadsheet programs make it easy to treat data sets as a visualization, which makes the data less flexible for multiple uses. It is possible programming may not be incorporated by learners, but these materials may help curate better datasets that can be used in data science teams. To address these critical gaps in knowledge, we will create a set of surveys that will inform us of the potential learners and assess the effectiveness of the learning materials. Lesson efficacy will be tested against learning objectives.
4.4 Experimental Design
Aim 1: Identify learner personas in the biomedical sciences by creating and validating learner self-assessment surveys.
Assessing the prior knowledge of potential learners in the medical and biomedical sciences who are interested in learning data science skills by creating a learner self-assessment where participants rate their own comfort in data, statistics, and programming skills.
Working Hypothesis
We hypothesize that learners will fall across the 3 main groups of the Dreyfus model of skill acquisition: novice, intermediate, and expert. These groups will be distinguishable based on their own comfort in 3 domains of data science (data, programming, and statistics knowledge). To test this, we will create a learner self-assessment survey. The survey will cover data, programming, and statistics knowledge and will have at least 2 questions asking about the same underlying concept for internal consistency. Results from the survey along with demographic information will be combined to create the personas. These personas will be used to inform the learning objectives for lesson materials.
Preliminary Data for Aim 1.
In preliminary studies, we found that we were able to cluster the respondents into 4 clusters using hierarchical clustering with Euclidean distance and Ward’s method. We then combined these clusters with the occupation question to come up with the 4 learner personas: clinicians (novice), academics (intermediate), students (intermediate), and programmers (experts). This gives us the framework we can use to expand the study to a larger population to both validate the survey instrument and the results.
1.1: Learner self-assessment survey asking questions about prior programming, statistics, and data knowledge will be used to create learner personas.
We will send out self-assessment surveys to various medical and biomedical groups around the Virginia Tech campus. We collected preliminary data over the summer of 2020 and had 51 participants consented to the survey. Figure 4.1 shows the grouped distribution of responses to the occupation demographic question (this is a select-all-that-apply question).
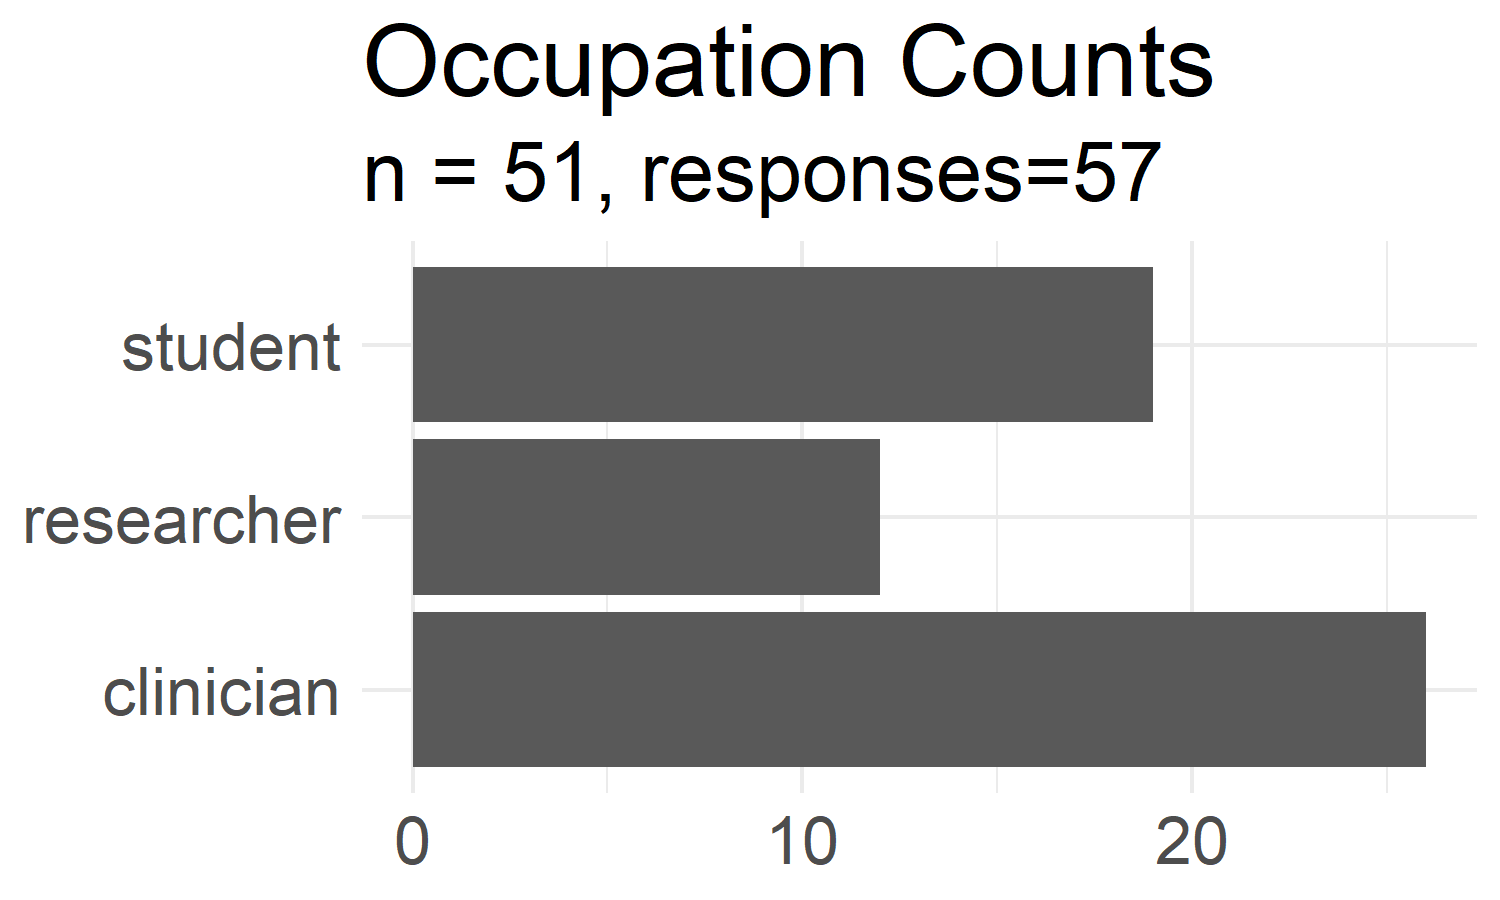
Figure 4.1: Grouped demographic counts. Occupation counts from learner self-assessment survey aggregated into one of the 3 groups shown. Each respondant had the option to select more than one occupation that applies to themself.
In general, we found that the overall group has low programming skills with basic data analysis skills primarily using Excel. They do not understand how data pipelines are created, and do not know how data can be processed into different “shapes” for analysis. An important framing of the materials would be to start with spreadsheet programs and tie their use into more advanced skills using programming languages (Farrell and Carey, 2018).
The survey also asks a summary Likert scale table of questions (Figure 4.2). These results confirm the overall findings where respondents typically do not use a programming language in their work and are indifferent towards programming in doing analysis. They did report that having access to the original raw data is important to repeat an analysis. This let us conclude that there is a lack of knowledge in the data literacy fundamentals where data can be transformed from user-friendly data curation formats to analysis-friendly formats in multiple pipeline steps.
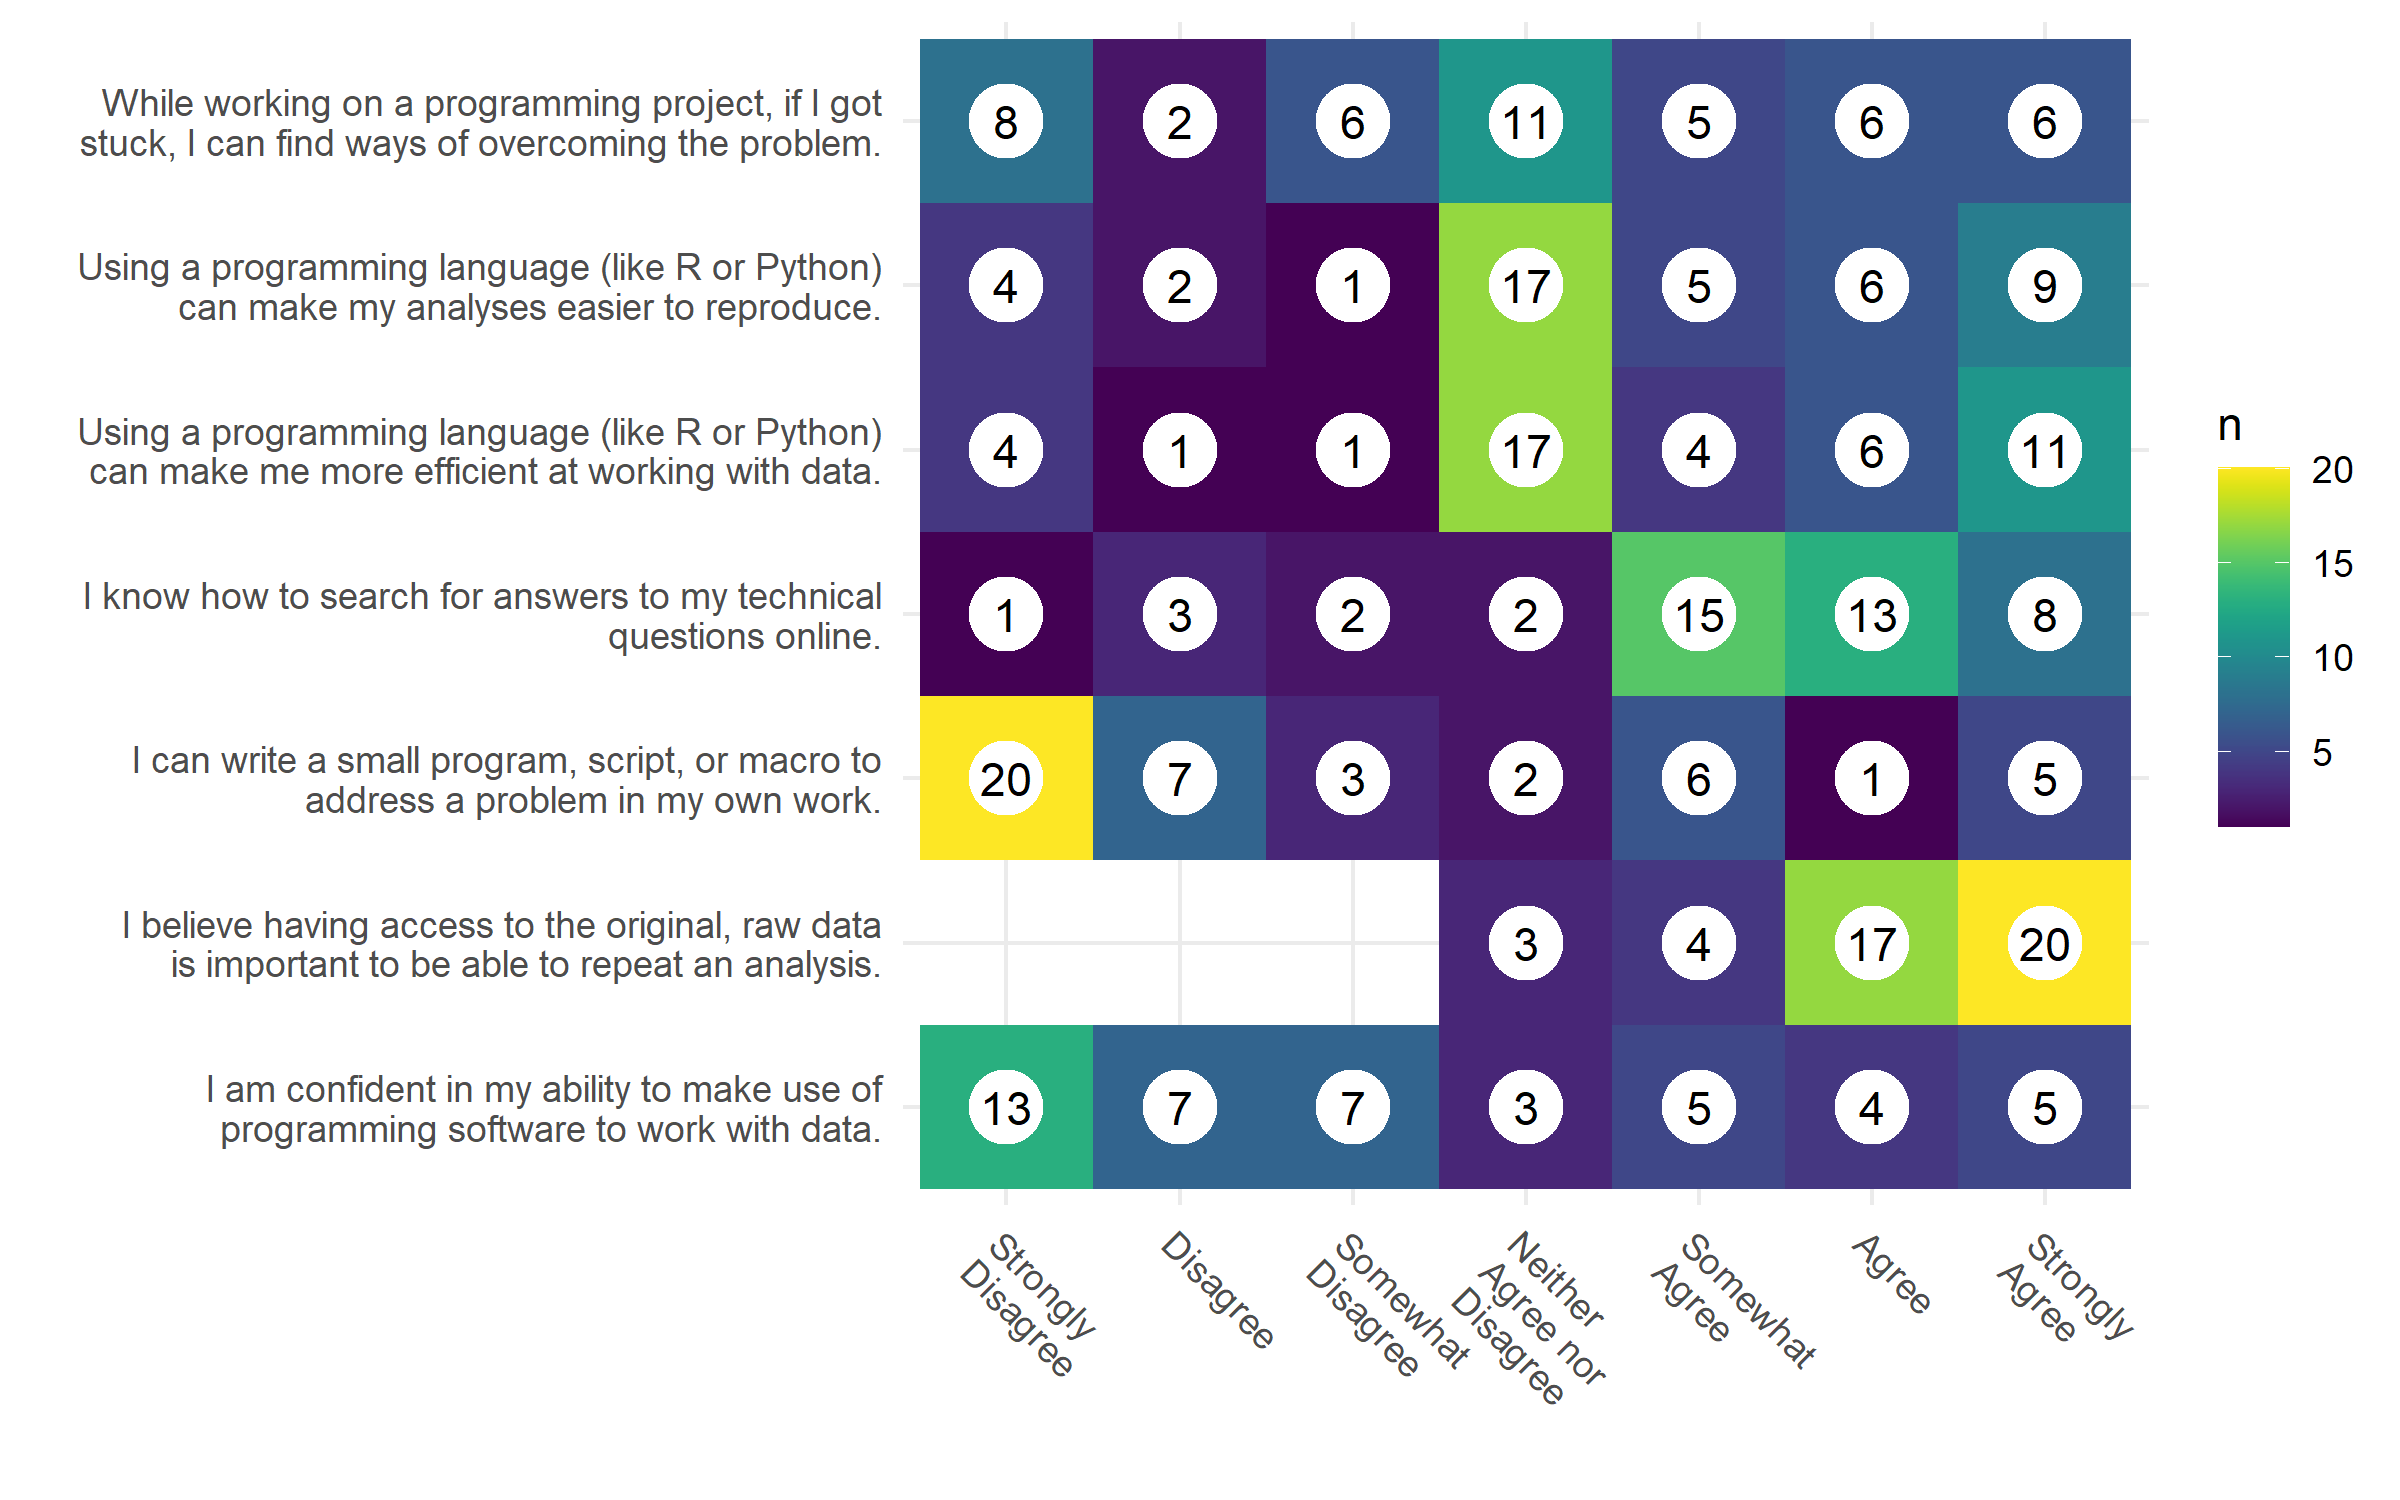
Figure 4.2: Summary Likert responses. Each respondanat was asked about their agreement towards each statment. Our population, overall, is unable and indifferent towards programming but finds access to the original raw data to be important to repeat an analysis. Preliminary breakdown of these results show that each of the personas will have a different set of responses to this Likert table.
1.2: Validate learner self-assessment survey.
The survey was designed with the questions in duplicate for internal validity, i.e., each construct was asked in 2 separate questions. These questions can be validated using Principal Component Analysis (PCA) and Exploratory Factor Analysis (EFA) results. The EFA results can also be used to simplify the survey to a representative set of questions. These questions can be used in future surveys to gain the same amount of information about learners without asking the entire battery of questions in our self-assessment survey. EFA was also used to simplify he survey down to 3 question, one for each of the knowledge domains.
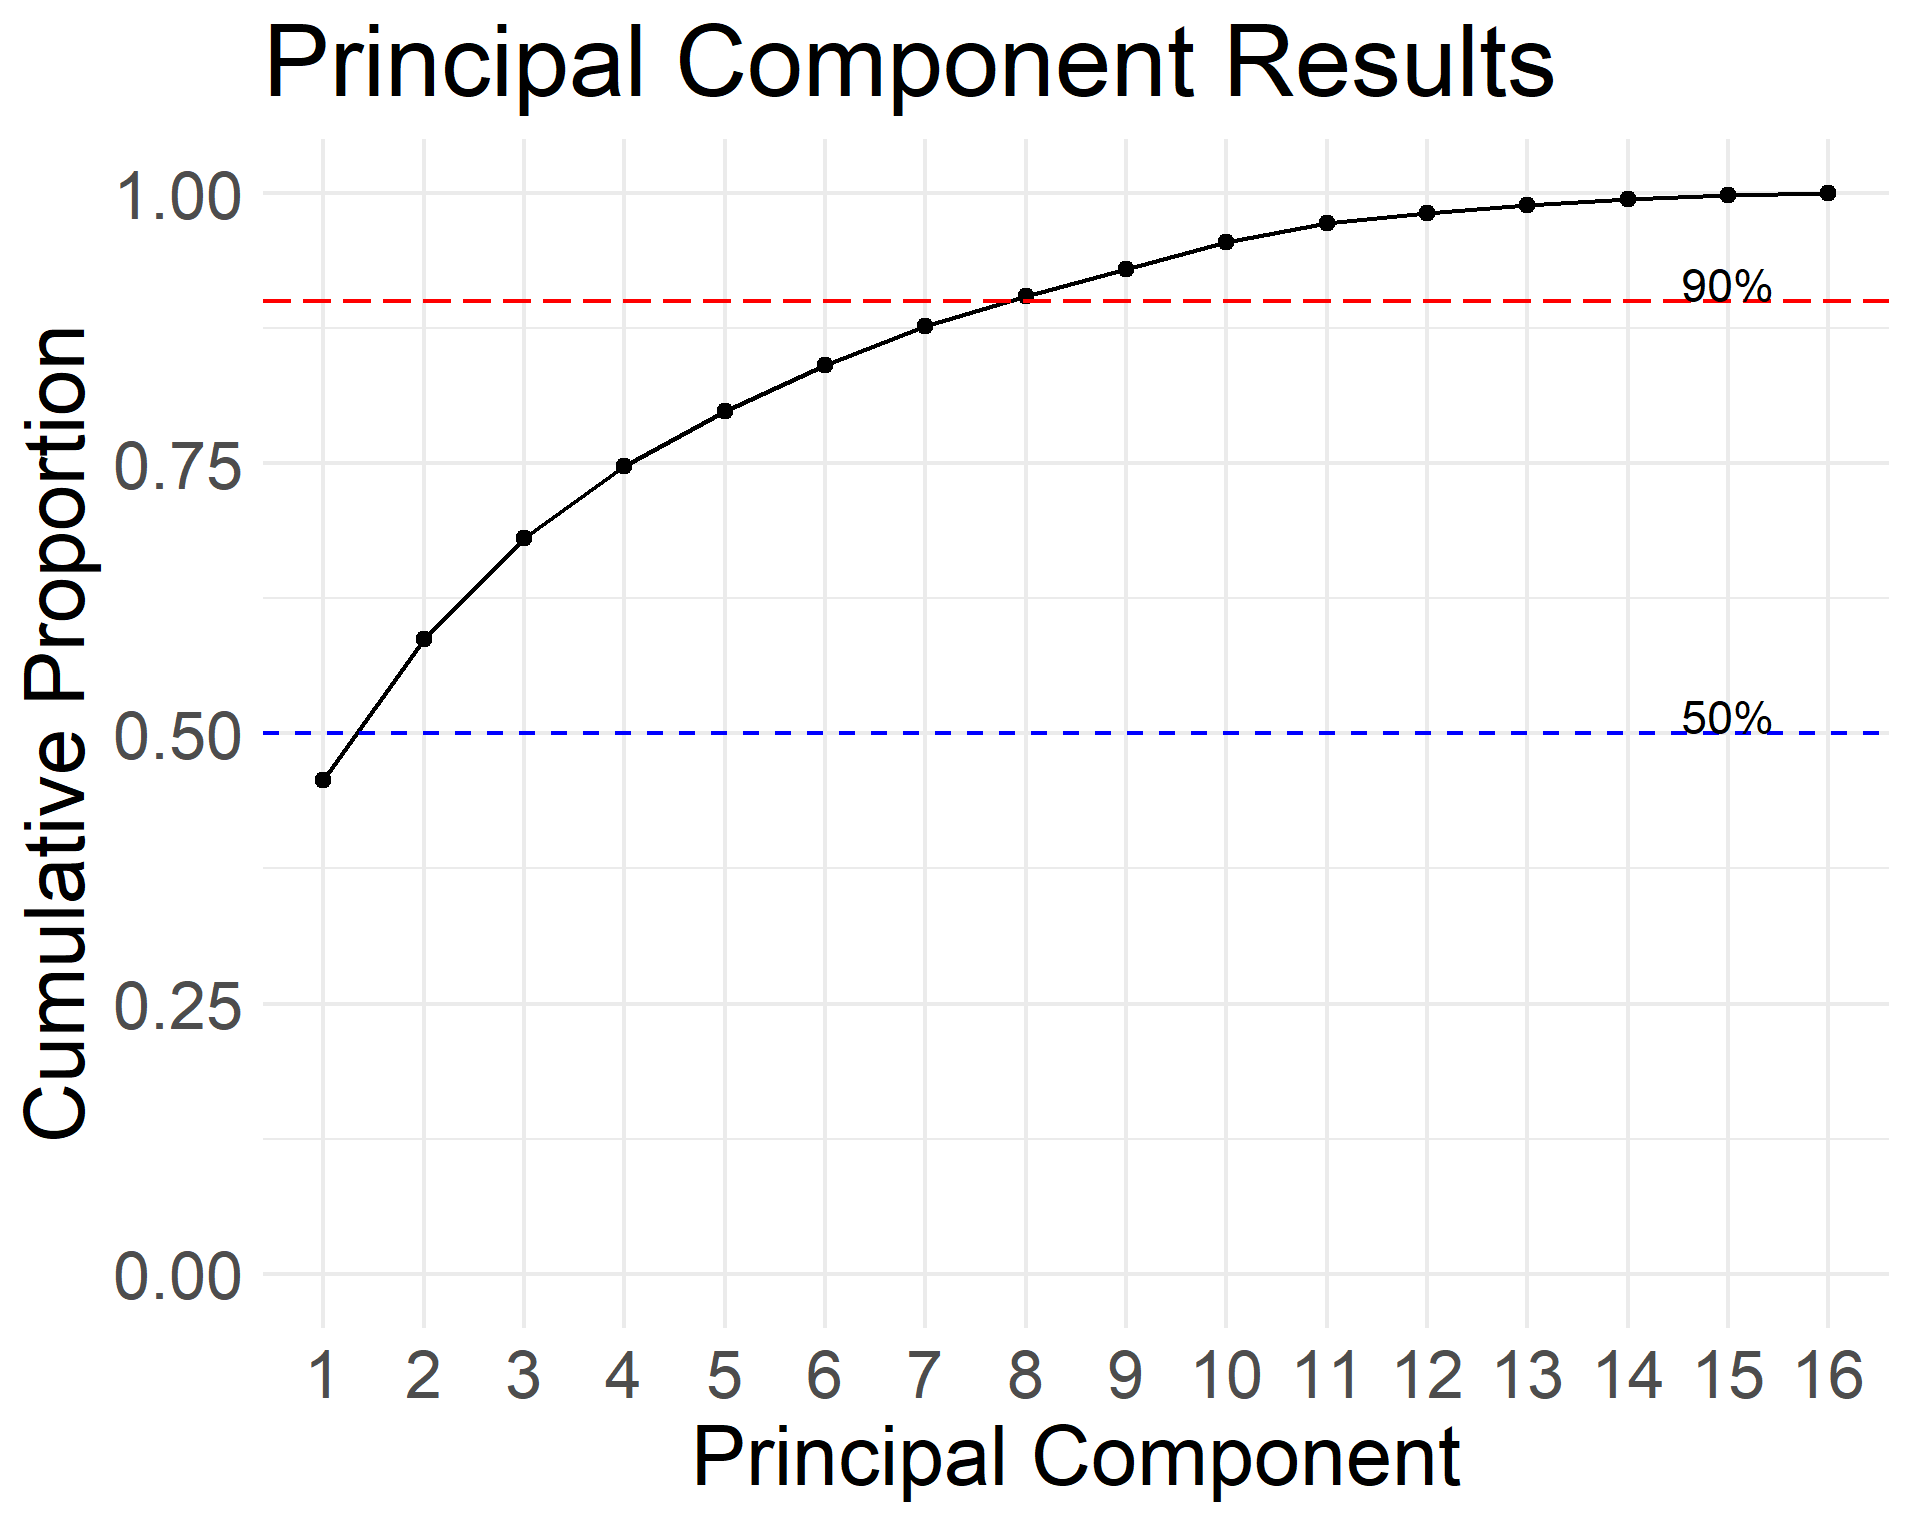
Figure 4.3: PCA results. Cumulative proporation of explained variance using PCA from the learner self-assessment survey. The PCA results show that half the questions (8) account for more than 90% of the explained variance and 1 principle component accounts for 46%.
Figure 4.3 shows how half of the questions (8 out of 16) account for more than 90% of the variance in PCA, with the first component accounting for 46% and 3 components accounting for 68%. Since our survey was designed using 3 main constructs: programming, statistics, and data knowledge, these results show that the survey was well designed and has internal consistency among the respondents. We also conducted an exploratory factor analysis on our preliminary data, and used 3 factors, one for each latent variable. The question loadings also followed the constructs in the survey, suggesting the validity of the survey. We would need to expand the survey to more participants to show its external validity. Given the preliminary data, we propose to perform more validation checks by increasing the sample size. We will be able to calculate the Cohen’s kappa coefficient to measure inter-rater reliability and the larger sample size will improve the external validity of the survey.
1.3: Personas will encompass a student’s prior knowledge using survey data. General background, perception of needs, and special considerations will be added to make each learner persona a complete character.
We used hierarchical clustering with Euclidean distance and Ward’s method on our preliminary data to create the learner personas (Figure 2.3).
This approach is validated from preliminary results showing the 4 learner personas from our data. We combined these groupings back with the survey occupation demographics to create the relevant prior knowledge portion of learner personas. Our preliminary data returns 4 personas that map on to the different stages of the Dreyfus model of skill acquisition: clinicians (novice), academics (intermediate), students (intermediate), and programmers (experts).
Anticipated results and their impact.
Preliminary results indicate that we can validate the learner self-assessment survey and use the survey results to create learner personas. This gives us an overview of the audience we would potentially teach in the medical and biomedical sciences. Since the final step of persona creation combines the demographic information, the base survey questions can be used across other domains, not just the one we are studying. This potentially gives us a tool to accurately gauge data science learners to better create learning materials for their needs.
Potential pitfalls, alternative approaches, and future directions.
The major route of data collection in this Aim is based on survey responses. This inherently means we will have reporting and response bias. The demographic breakdown in our learner self-assessment was diverse (Figure 4.1), but our preliminary data was only collected from Virginia Tech students and faculty from biomedically relevant listservs. Future directions would include increasing the survey pool to get a better representation of potential learners. A larger survey pool would also help with the survey validation by potentially surveying a more diverse population and increase our N for the analysis. Our initial survey had 57 respondents, where 51 consented to the study, and 45 responses were used for the analysis. These results were from a convenience sample from listservs at the university
Aim 2: Create an effective data science for biomedical science curriculum based on best education and pedagogy practices.
Creating materials that are community-oriented, open, maintained, accessible, follows best pedagogical practices, and domain-specific is a key component to creating authentic tasks to aid in learner motivation. Using the feedback from learners to assess the learning materials, we can create more relevant learning modules, and the surveys and feedback system can be adapted to create other domain-specific learning materials.
Working Hypothesis
We hypothesize that a data science curriculum focused on data literacy principles from working with spreadsheet data will be the most relevant to our learners. We also hypothesize that the learning objectives we create will give the learner confidence in performing their own data analysis after going through the materials. By catering to the learner’s needs, and teaching the data literacy fundamentals, learners will be more motivated to continue learning on their own. To test this hypothesis, we will create a set of pre-workshop, post-workshop, and long-term workshop surveys. Since this is an observational study, we will use the learner’s confidence on their ability to accomplish a task as a proxy for meeting learning objectives. There will be a set of self-assessment and learning objective tasks that will be asked across all surveys to measure differences in response longitudinally.
Preliminary Data for Aim 2.
A data science curriculum based on learner personas was created and used to teach a set of workshops. Preliminary data collected before and after the workshop compare a learner’s confidence of meeting learning objectives and show that the learners are more confident in their skills and learning objectives (Figure 4.4 and Figure 4.5).
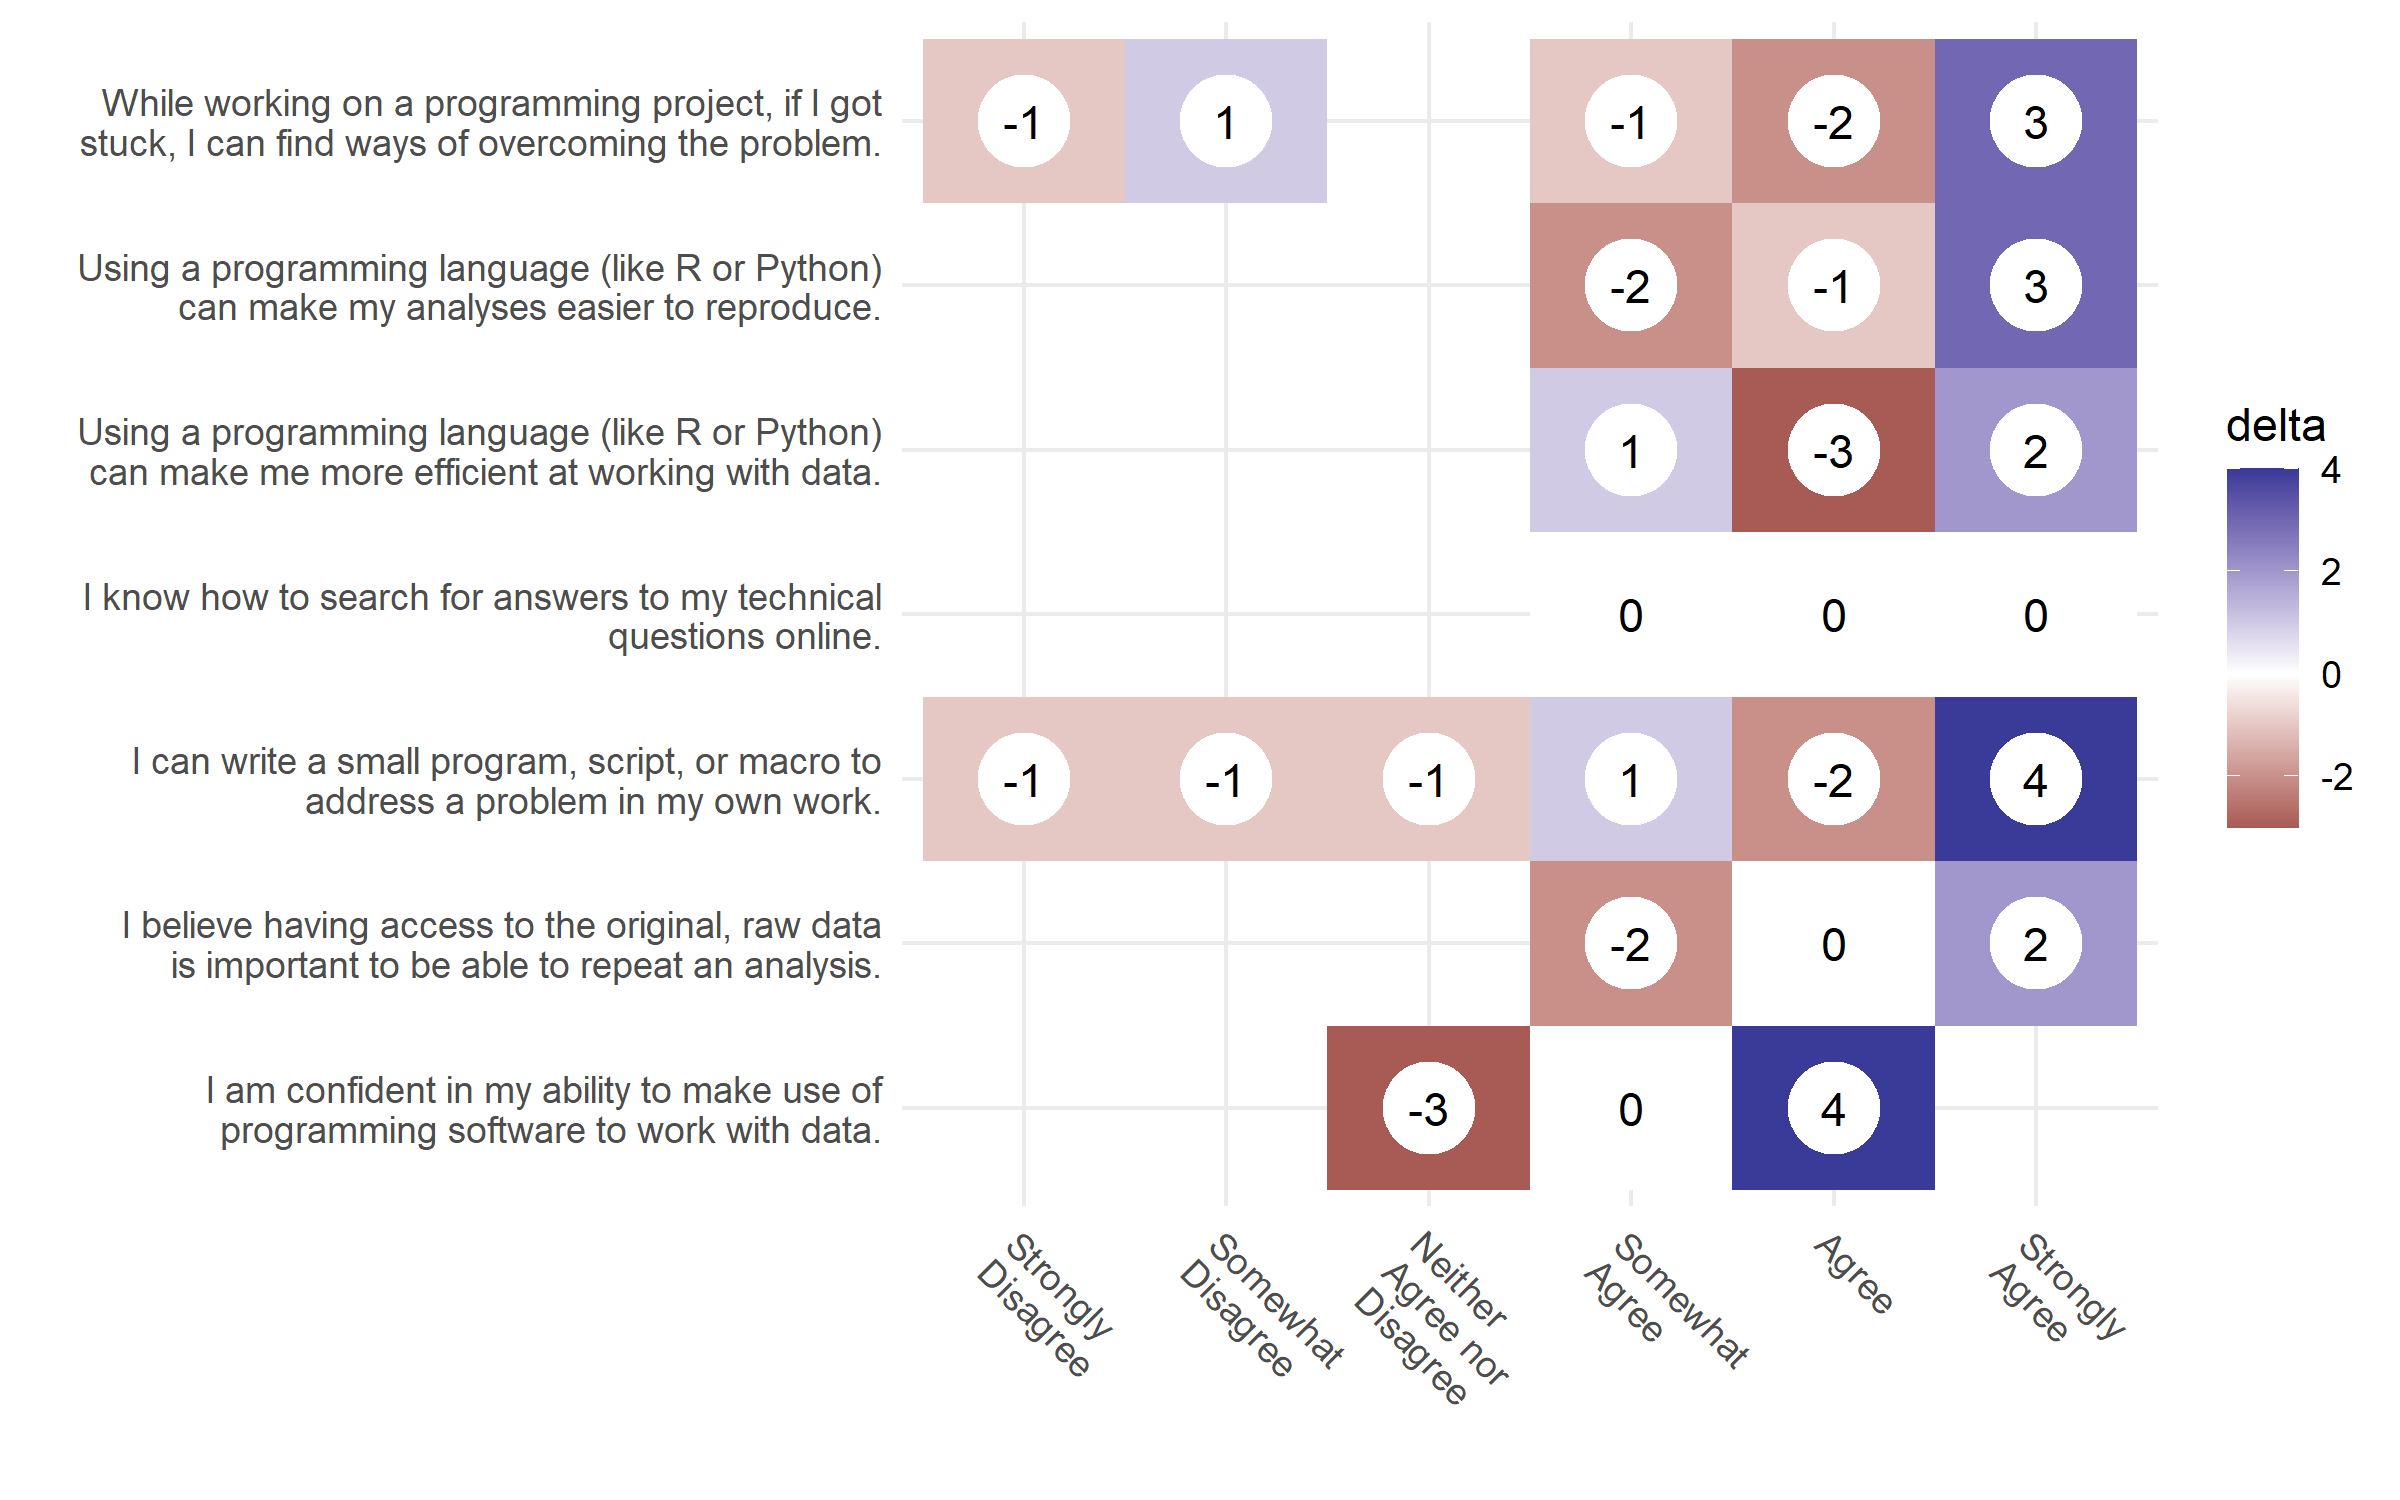
Figure 4.4: Changes from the pre-wokshop and post-workshop responses. The numbers show the differences from the pre-workshop counts, from the post-workshop counts. White (0) means there was a net 0 difference between reponses. Blue represents where more responses went to after the workshop and red represents the number of people who migrated from a particular response after the workshop.
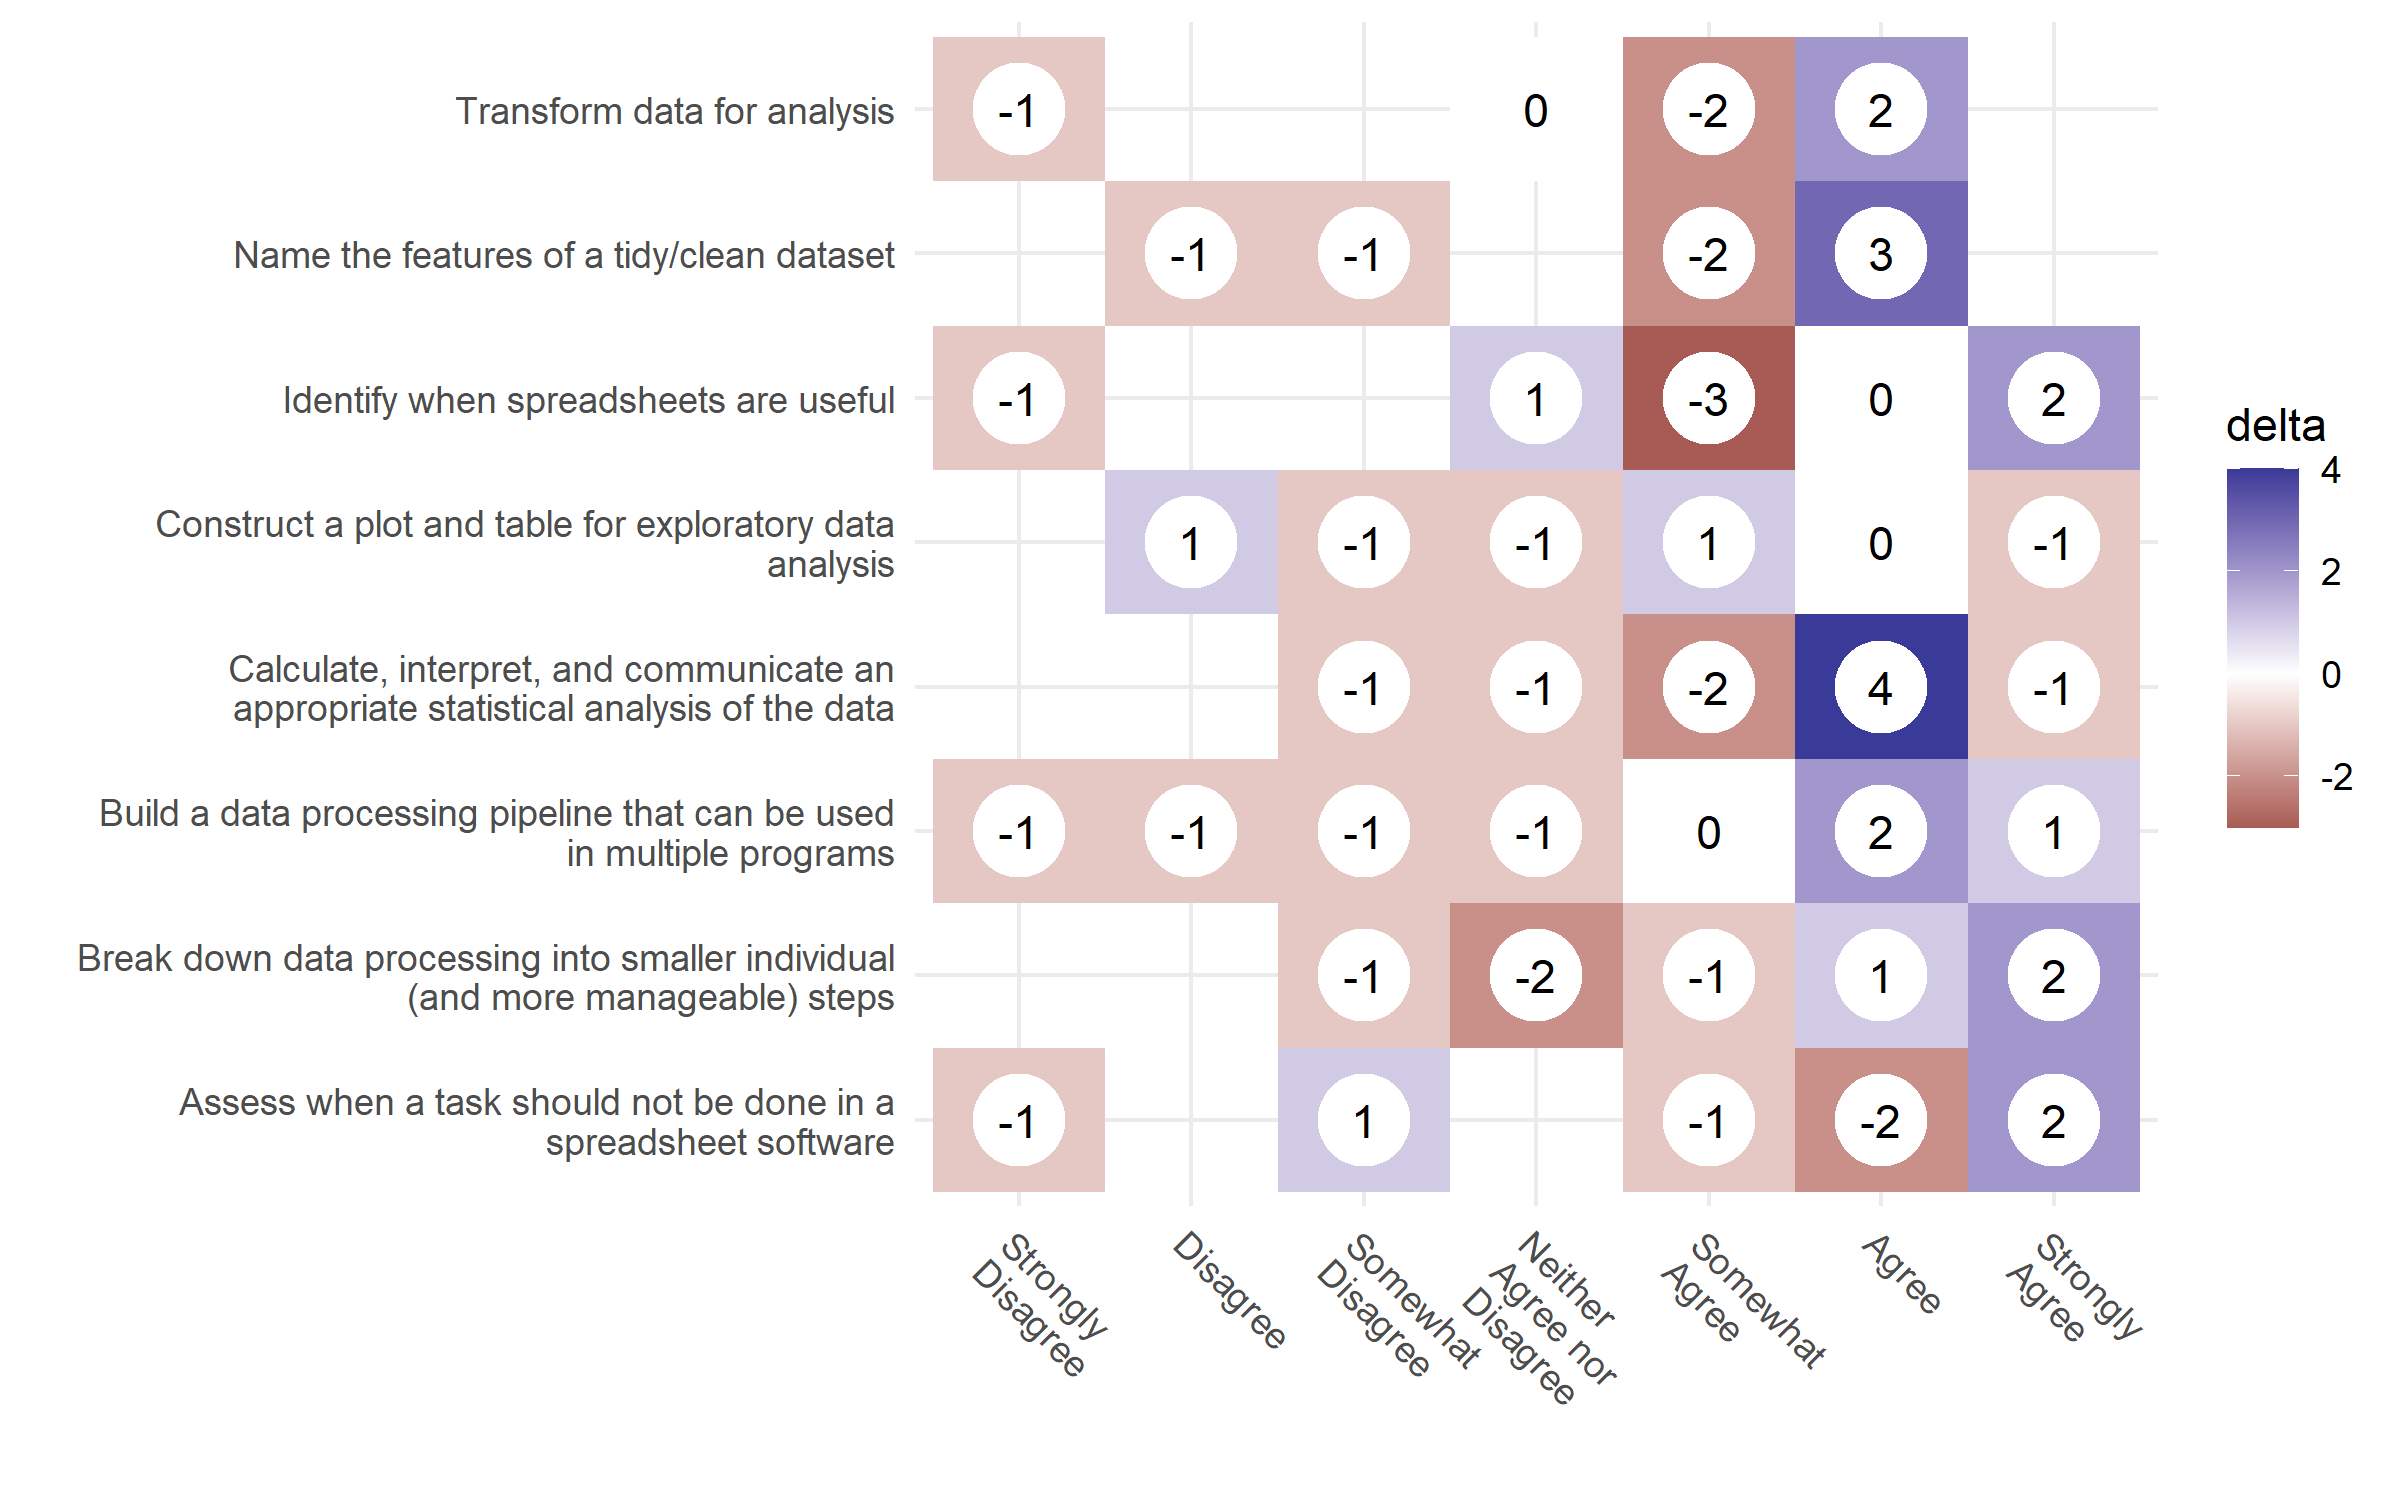
Figure 4.5: Learning objective pre-post changes. Changes in the learner’s confidence in the workshop’s learning objectives from the pre-workshop and post-workshop surveys. The delta represents the net differences of responses in the post-workshop survey.
In both figures, the number of responses from the pre-workshop results was subtracted from the number of results in the post-workshop results, giving us the net change in people after the workshop. A blue positive number indicates the shift in the number of participants at the end of the workshop, compared to the red negative numbers pre-workshop.
These results came from 3 workshops, totaling of 72 registrants (Oct: 27, Feb: 45). From this we were able to teach 39 workshop attendees (Oct: 20, 11; Feb: 19, 16) and collected 25 pre-workshop responses, and 12 post workshop responses. We estimate we would need to run at least 12 more workshops to get enough respondents for the post-workshop responses. For the long-term survey (6 months), we may need to provide a financial incentive for participants to get enough responses.
2.1: Learning objectives focused on core data literacy principles in the data science pipeline will be used for each lesson module.
In this sub aim, we will create a data science curriculum that ties together data literacy and data management pipelines with the skills used in data science. Our preliminary learner personas guided us to use spreadsheet programs (e.g., Excel, LibreOffice, Google Sheets, etc.) as the first lesson module to orient the learners and use “tidy data principles” as the underlying theme to transform data. Preliminary data and a survey of available lesson materials show that there is a gap in available teaching materials that link data literacy concepts of data management and processing with other steps in the data science process. The initial modules will cover spreadsheets and data literacy basics, loading data into a programming language, tidy data principles, plotting, and logistic regression. Additional modules will cater to the feedback survey from the learners.
2.2 Lesson content follow best educational and pedagogical best practices.
The lesson materials created will follow the best educational and pedagogical best practices for learning programming. This includes: (1) using a backwards-design approach to formulate the learning objectives from formative assessment questions (Wilson, 2019); (2) blocks of content that fit roughly 50-minute segments to allow for breaks and formative assessments (Farrell and Carey, 2018). The materials are also created to work in the context of classroom “periods”; (3) live-coded workshops where the instructor has learners follow along as the concepts are taught and discussed (Farrell and Carey, 2018); (4) code of conduct for learners to feel safe in the learning environment (Ambrose et al., 2010; Wilson, 2019); (5) live captioning during the workshop event and descriptive alternative text for each figure and image in the online materials to work with screen readers for accessibility. By creating materials that assume no prior knowledge of programming and use relevant examples, students are likely to be more engaged with learning the materials (Ambrose et al., 2010; Farrell and Carey, 2018; Wilson, 2019).
2.3 Assess the effectiveness of learning materials.
In this sub aim, we will assess how effective the lesson materials and its learning objectives are by comparing results from a pre-workshop and post-workshop survey. Survey participants will have a unique identifier that can be used to track individual differences and be aggregated to look at the overall effect changes before and after the workshop. Preliminary data shows that learner’s confidence in various tasks and learning objectives do improve after the workshop. A long-term survey will be sent out to workshop participants to see retention of learning objectives, if learners found the workshop useful, and if learners have continued to learn and work on their own projects.
Anticipated results and their impact.
We anticipate that a lesson curriculum that incorporates existing tools and prior knowledge of spreadsheets will help learners fill in gaps of their data literacy mental model when working with data in data science projects. By focusing on data literacy concepts, we are building a curriculum that promotes FAIR principles. This aim will create a tested learning curriculum that can be adapted into many teachings and learning formats. The book can be done as supplemental reading or as self-paced reading, the slides provide major points that can be used in a lecture or presentation, and recordings are provided to learners either as a reference or material for new learners who cannot attend a live workshop setting. These materials lay the groundwork for a community-oriented, open, accessible, and pedagogically sound curriculum that can be used to enhance the data science and research workforce in the biomedical sciences and adapted to other domains.
Potential pitfalls, alternative approaches, and future directions.
Our preliminary data shows more reporting bias than our learner self-assessment survey. Most of the respondents from the workshop surveys are students, and not from the other occupation groups. This problem can be remedied by conducting more workshops to collect more data which may offset the bias. Our surveys mainly measure the learner’s confidence towards a learning objective as a proxy for a summative assessment. These results are self-reported and may show response bias.
Aim 3: Assess the effectiveness of formative assessments in learning objectives.
Formative assessments “forms” the teaching in real time by informing the instructor what concepts learners are getting wrong (Wilson, 2019). At the end of a lesson, a summative assessment can be used to assess learners about all of the individual concepts integrated together. Ambrose et al. (2010) tells us that “goal-directed practice coupled with targeted feedback are critical to learning.” Examining if automatic grading systems can be combined with informative feedback can lead to better learning outcomes can identify techniques to improve the democratization of data science education.
Working Hypothesis.
We hypothesize that formative assessments with targeted and informative feedback about incorrect solutions, will allow learners to complete formative and summative assessment questions with a higher rate of success. We expect that guiding learners with Parson’s problems and Faded in formative feedback exercises will help them solve summative feedback questions faster.
Preliminary Data for Aim 3.
Our hypothesis is based on computer science education literature that uses different question types for formative assessment questions to aid in learning content. These question types (Faded examples and Parson’s problems) are used in lieu of a blank box where the learners write code from scratch because it lowers the cognitive load of the learners and allows them to focus on the key aspect of the coding exercise, instead of wrestling with the syntax of the code.
3.1: Implement an experiment for conducting formative and summative assessment question types.
The shinysurveys R package provides the framework needed to create and
administer an experimental study that can be used to collect response data from
user submitted code. It leverages the learnr R package that allows instructors
to create lesson materials with an input field that can execute code. The
gradethis library can be used to check R and Python code for the correct result
to provide feedback to the student. gradethis also can check the syntax of the
code itself to point to an exact part of the code that is incorrect, instead of
giving a programming error or non-meaningful “incorrect” message. shinysurveys
can be used in conjunction with the tools and techniques from “Data Science in a
Box” to collect the responses from the student for analysis using the learnrhash
library. These responses are “hashed” such that all the data that is encoded is
resented in plain text, but indecipherable to the user.
3.2: Assess the effectiveness of targeted feedback in auto-grading systems used in formative and summative feedback.
In this aim, we will show an improvement in the success rate of assessment
questions when targeted feedback about the incorrect solution is given by the
learner. We recognize the importance of feedback in the learning process
(Ambrose et al., 2010),
but it is not possible to give real-time feedback during many assessment
questions, especially when teaching at scale. We hope to take the results from
our implementation of shinysurveys and “Data Science in a Box” to collect
learner assessment performance and compare the differences between learners who
are given several types of assessment questions from those who are simply given
an empty box to type code with and without informative feedback from the
auto-grader. We currently have a population of students in our own lab,
DataBridge, with new data science learners who can be used to take entire
workshops and/or short modules where the results from the formative and
summative assessments can be recorded.
Anticipated results and their impact.
We predict an improvement in speed and correct responses in students’ final summative assessment when they are given who are given question types rather than an empty text box in the formative assessment. While these question types are used in computer science education literature, these techniques have not been studied yet to show whether adding the cognitive load of completing a data related task helps with learning the materials. We anticipate that these results will give future educators the types of questions that can be used for formative assessments when teaching.
Potential pitfalls, alternative approaches, and future directions.
The study will aim to only teach a single portion of the overall lesson materials, it is possible that the amount of information used for this aim will be either too simple or too complex for participants given the time constraints. If that is the case, we may resort to only looking at the amount of time to complete a solution, rather than comparing if the distinct groups are answering the question correctly. An additional set of workshops are also going to be planned to include the data collection portion of this aim. Since the workshop is going to be more time intensive, there will be a bias in the participants who sign up to attend the study. This aim will provide the basis of incorporating a formative and summative assessment system that can be used in a live teaching environment so the instructor can get feedback about topics and concepts that the learners are grasping. These results will be combined with the demographic information with the learners and can be combined with our persona results to curate a better learning curriculum for our learners.
References
Ambrose, S. A., Bridges, M. W., DiPietro, M., Lovett, M. C., and Norman, M. K. (2010). How learning works: Seven research-based principles for smart teaching. John Wiley & Sons.
Dolgopolovas, V., and Dagienė, V. (2021). Computational thinking: Enhancing STEAM and engineering education, from theory to practice. Computer Applications in Engineering Education, 29(1), 5–11. https://doi.org/10.1002/cae.22382
Farrell, K. J., and Carey, C. C. (2018). Power, pitfalls, and potential for integrating computational literacy into undergraduate ecology courses. Ecology and Evolution, 8(16), 7744–7751. https://doi.org/10.1002/ece3.4363
Song, I.-Y., and Zhu, Y. (2016). Big data and data science: What should we teach? Expert Systems, 33(4), 364–373. https://doi.org/10.1111/exsy.12130
Wilson, G. (2019). Teaching tech together: How to make your lessons work and build a teaching community around them. CRC Press.