Main reason to use Shiny Modules
- You really create a shiny module so you can reuse it.
- That’s the entire point of namespacing.
So, we can…
- Create a UI where we have multiple datasets and each dataset has a filter + dataframe view card

Share a few tips, tricks, and “code smells” for using Shiny modules
Shiny modules:
Similar to a normal function
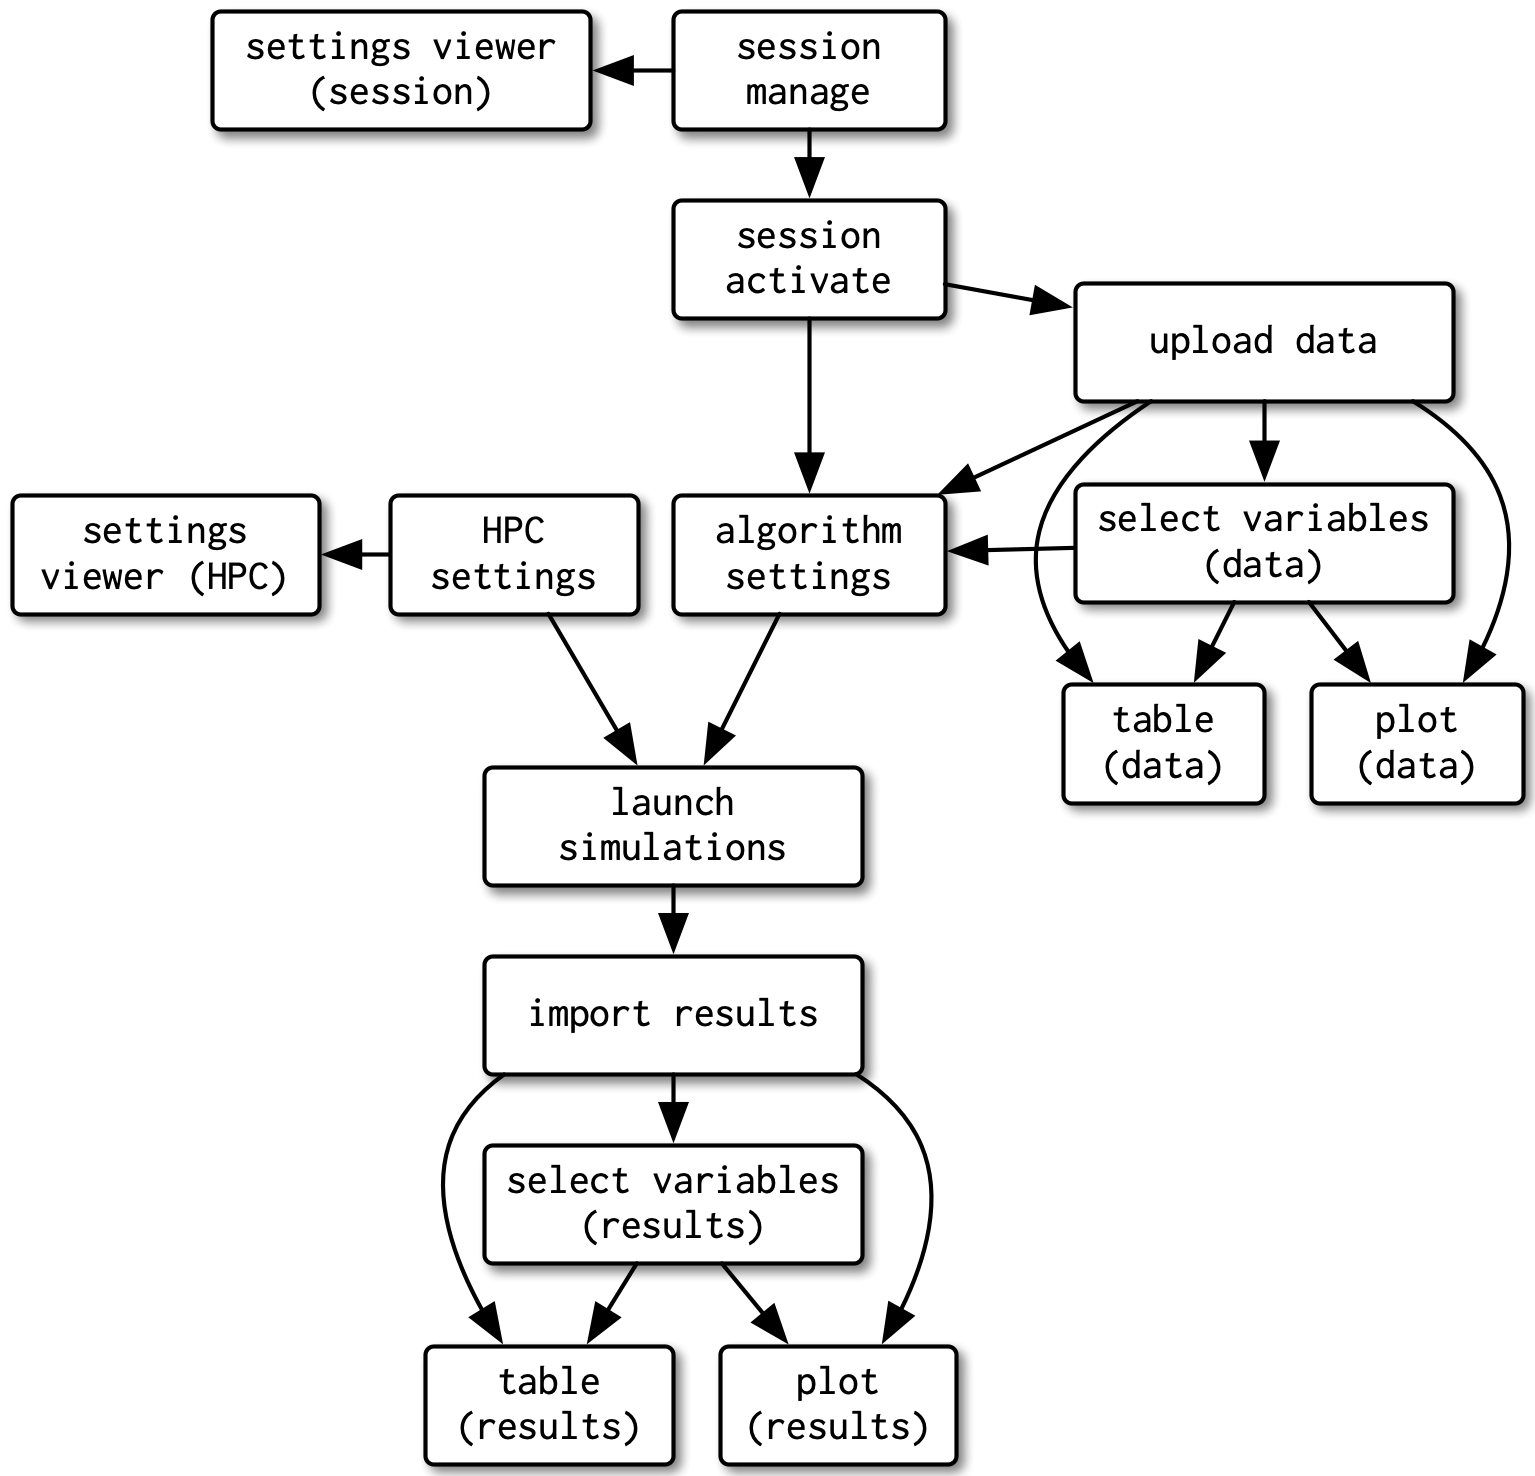
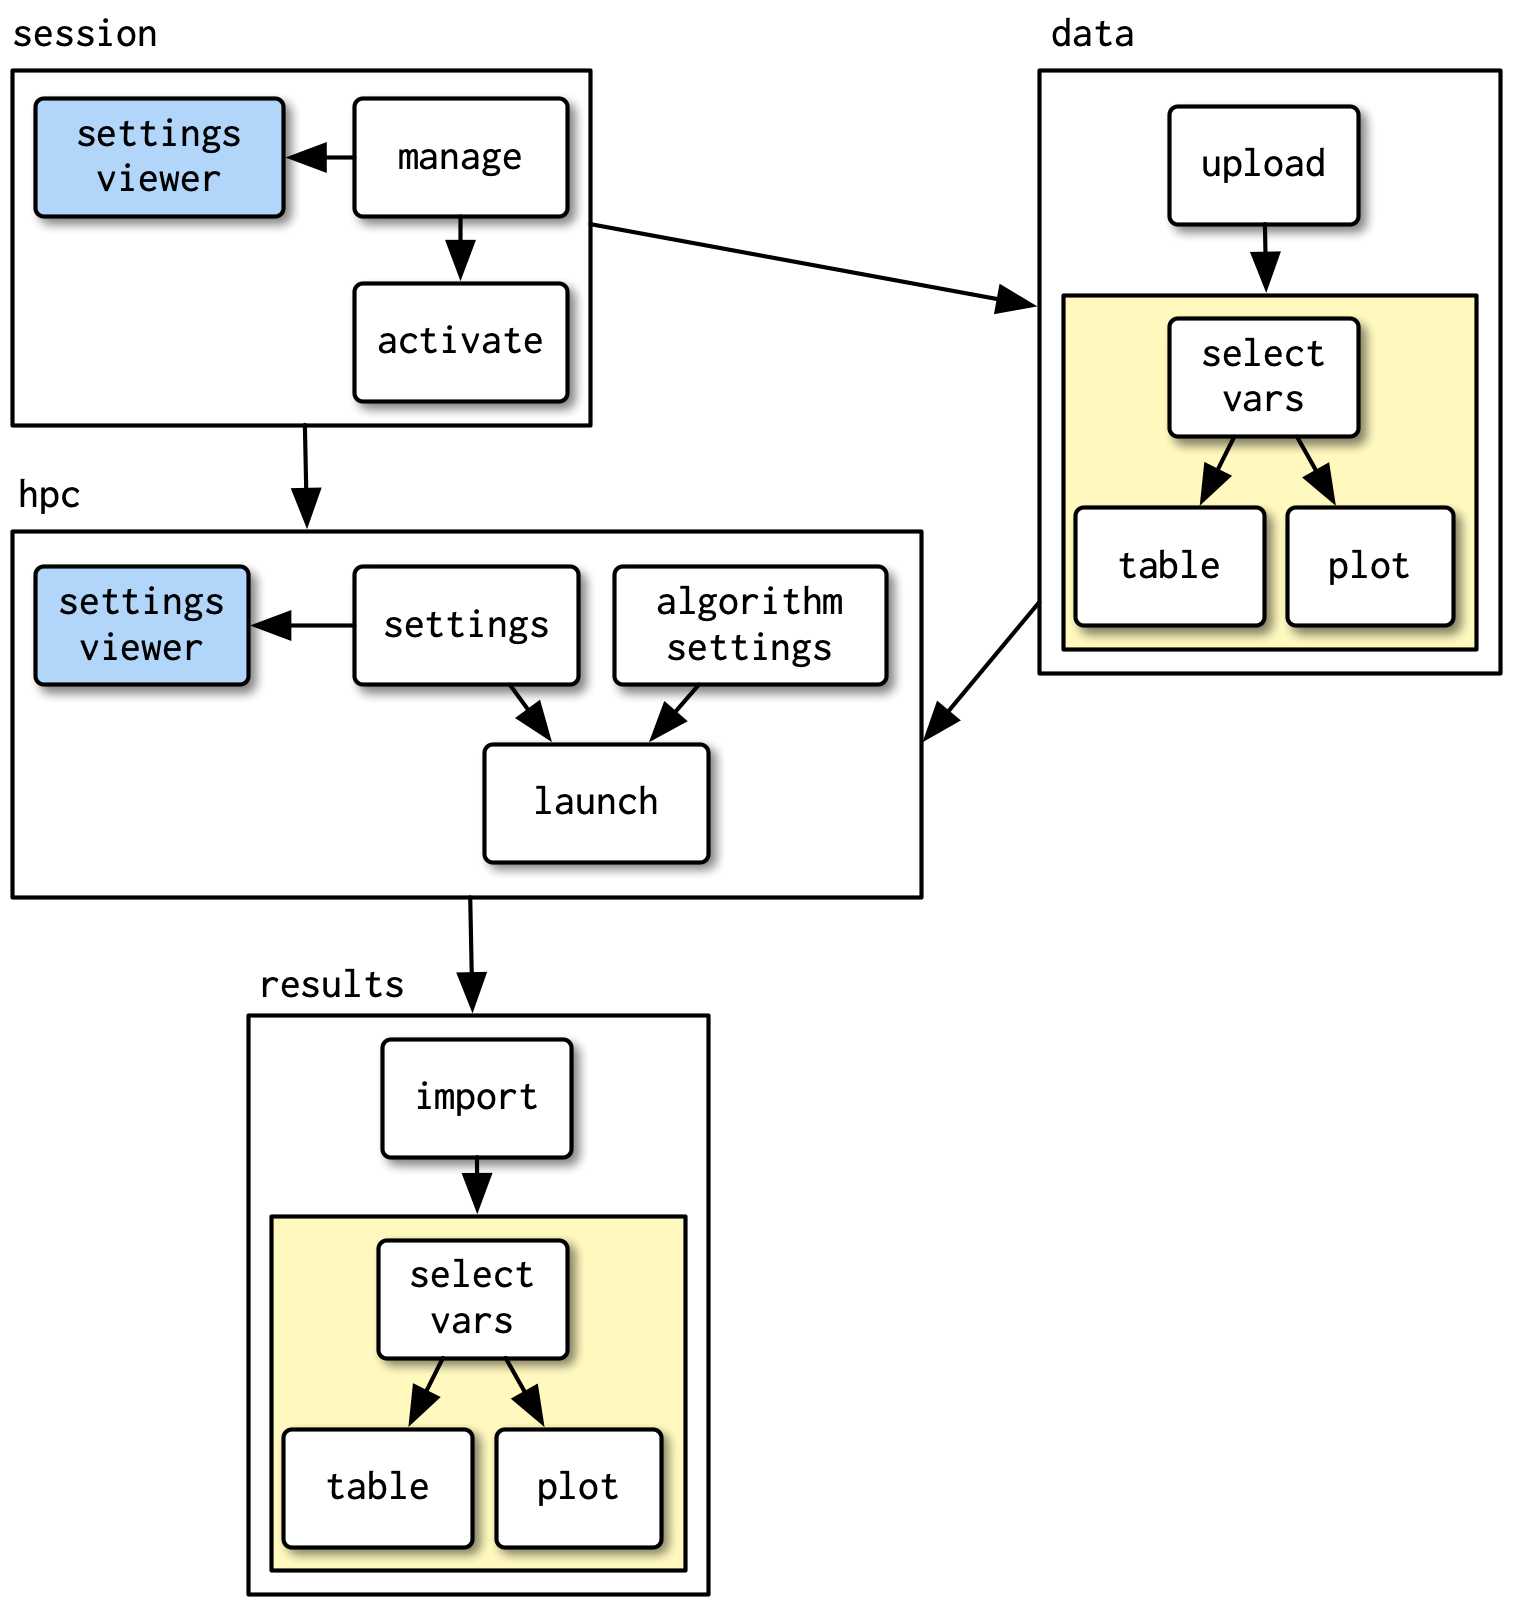
#| '!! shinylive warning !!': |
#|   shinylive does not work in self-contained HTML documents.
#|   Please set `embed-resources: false` in your metadata.
#| standalone: true
#| viewerHeight: 550

# app-01
#
# The base app if you were making everything one piece at a time
#
# problem: lots of manual UI and server code that is repeated

from shiny import App, ui, reactive, render
import pandas as pd
from palmerpenguins import load_penguins

penguins = (
    load_penguins()
    .dropna()
    .loc[:, ["species", "bill_length_mm", "body_mass_g"]]
)

app_ui = ui.page_sidebar(
    ui.sidebar(
        ui.input_checkbox_group(
            id="filter_species",
            label="Select species",
            choices=sorted(penguins["species"].unique()),
            selected=sorted(penguins["species"].unique()),
        ),
        ui.input_slider(
            id="filter_bill_length_mm",
            label="Range for bill_length_mm",
            min=float(penguins["bill_length_mm"].min()),
            max=float(penguins["bill_length_mm"].max()),
            value=[
                float(penguins["bill_length_mm"].min()),
                float(penguins["bill_length_mm"].max()),
            ],
            step=1,
        ),
        ui.input_slider(
            id="filter_body_mass_g",
            label="Range for body_mass_g",
            min=float(penguins["body_mass_g"].min()),
            max=float(penguins["body_mass_g"].max()),
            value=[
                float(penguins["body_mass_g"].min()),
                float(penguins["body_mass_g"].max()),
            ],
            step=1,
        ),
    ),
    ui.card(
        ui.card_header("Filtered Penguins Data"),
        ui.output_data_frame("filtered_data"),
    ),
)


def server(input, output, session):
    @reactive.calc
    def get_filtered_data():
        # Start with all rows
        mask = pd.Series(True, index=penguins.index)

        # Apply filters for each column
        for col in penguins.columns:
            if pd.api.types.is_numeric_dtype(penguins[col]):
                min_val, max_val = input[f"filter_{col}"]()
                mask = (
                    mask
                    & (penguins[col] >= min_val)
                    & (penguins[col] <= max_val)
                )
            else:
                selected_categories = input[f"filter_{col}"]()
                mask = mask & penguins[col].isin(selected_categories)

        # Return the filtered data
        return penguins[mask]

    @render.data_frame
    def filtered_data():
        return get_filtered_data()


# Create and return the app
app = App(app_ui, server)
app_ui = ui.page_sidebar(
    ui.sidebar(
        ui.input_checkbox_group(                              #<<
            id="filter_species",
            label="Select species",
            choices=sorted(penguins["species"].unique()),
            selected=sorted(penguins["species"].unique()),
        ),
        ui.input_slider(                                      #<<
            id="filter_bill_length_mm",
            label="Range for bill_length_mm",
            min=float(penguins["bill_length_mm"].min()),
            max=float(penguins["bill_length_mm"].max()),
            value=[
                float(penguins["bill_length_mm"].min()),
                float(penguins["bill_length_mm"].max()),
            ],
            step=1,
        ),
        ui.input_slider(                                      #<<
            id="filter_body_mass_g",
            label="Range for body_mass_g",
            min=float(penguins["body_mass_g"].min()),
            max=float(penguins["body_mass_g"].max()),
            value=[
                float(penguins["body_mass_g"].min()),
                float(penguins["body_mass_g"].max()),
            ],
            step=1,
        ),
    ),
    ui.card(
        ui.card_header("Filtered Penguins Data"),
        ui.output_data_frame("filtered_data"),
    ),
)def server(input, output, session):
@reactive.calc #<< reactive calc
def get_filtered_data():
# Start with all rows #<<
mask = pd.Series(True, index=penguins.index) #<< mask
# Apply filters for each column #<< apply filters
for col in penguins.columns: #<< for each column
if pd.api.types.is_numeric_dtype(penguins[col]): #<< if numeric
min_val, max_val = input[f"filter_{col}"]()
mask = (
mask
& (penguins[col] >= min_val)
& (penguins[col] <= max_val)
)
else: #<< else
selected_categories = input[f"filter_{col}"]()
mask = mask & penguins[col].isin(selected_categories)
# Return the filtered data #<< return filtered data
return penguins[mask] #<<
@render.data_frame #<< dataframe to display
def filtered_data(): #<<
return get_filtered_data() #<<# use a loop instead of listing individual components #<<
ui_filters = {} #<< dictionary to hold the filters by name
for col in penguins.columns: #<< loop through the columns specified
# numeric columns have a 2 way slider
if pd.api.types.is_numeric_dtype(penguins[col]):
ui_filters[col] = ui.input_slider( #<< add the component to the dict
id=f"filter_{col}",
label=f"Range for {col}",
min=float(penguins[col].min()),
max=float(penguins[col].max()),
value=[
float(penguins[col].min()),
float(penguins[col].max()),
],
step=1,
)
else:
# categorical columns get a checkbox
ui_filters[col] = ui.input_checkbox_group( #<< add a different component
id=f"filter_{col}",
label=f"Select {col}",
choices=sorted(penguins[col].unique()),
selected=sorted(penguins[col].unique()),
)for col in penguins.columns:
if pd.api.types.is_numeric_dtype(penguins[col]):
min_val = float(penguins[col].min())
max_val = float(penguins[col].max())
ui_filters[col] = {
"filter_method": "sliders2_between", #<< what kind of filter
"component": ui.input_slider( #<< actual component
id=f"filter_{col}",
label=f"Range for {col}",
min=min_val,
max=max_val,
value=[min_val, max_val],
step=1,
),
}
...
ui.sidebar(
*[(ui_filters[col]["component"]) for col in penguins.columns], #<< all components in the UI
),UI code
Server code
for loop to create the input componentsfor loop to read the input componentsfor loop to place the input components in the UI@render.uiid values and iterating over and calling a function that makes a component.id and some other input for the component.
id or label, but can also include things like a column name of a dataframe.zip() functionMore on the Shiny for Python Module documentation: https://shiny.posit.co/py/docs/modules.html
All 3 bits of information needed to be tracked together.
cols = ["size", "id", "total_bill"]
col_types = ["cat", "cat", "sliders"]
filters = ["filter_size", "filter_id", "filter_total_bill"]

for fltr, col, col_type in zip(filters, cols, col_types):
...@reactive intermediate stepsserver() and ui# UI snippet
for col in columns:
if pd.api.types.is_numeric_dtype(df[col]): #<< need a data type check
min_val = float(df[col].min())
max_val = float(df[col].max())
ui_filters[col] = {
"filter_method": "sliders2_between", #<< specify the slider type
"component": ui.input_slider( #<< specify component
f"filter_{col}", #<< create component ID
...
# server snippet
for col in penguins.columns:
if ui_filters[col]["filter_method"] == "sliders2_between": #<< make slider type check
min_val, max_val = input[f"filter_{col}"]() #<<
mask = mask & penguins[col].between(min_val, max_val) #<<
elif ui_filters[col]["filter_method"] == "list_isin":
...Reactive calculations need to happen in a reactive context
Otherwise similar to a Python “module”
Also:
def create_ui_filters(data, columns):                #<< filter creating as a function
    ui_filters = {}

    for col in columns:
        if pd.api.types.is_numeric_dtype(data[col]):
            min_val = float(data[col].min())
            max_val = float(data[col].max())
            ui_filters[col] = {
                "filter_method": "sliders2_between",
                "component": ui.input_slider(
                    id=f"filter_{col}",              #<< IDs need to be namespaced if colnames repeat
                    label=f"Range for {col}",
                    min=min_val,
                    max=max_val,
                    value=[min_val, max_val],
                    step=1,
                ),
            }

        else:
            ...

return ui_filters@module.server
def filter_server(input, output, session, data, columns): #<< pass in other variables
ui_filters = create_ui_filters(data, columns) #<< !! create the inputs inside the server
...
@reactive.calc
def get_filter_mask(): #<< same reactive
mask = pd.Series(True, index=data.index)
for col in columns:
if ui_filters[col]["filter_method"] == "sliders2_between":
min_val, max_val = input[f"filter_{col}"]()
mask = mask & data[col].between(min_val, max_val)
elif ui_filters[col]["filter_method"] == "list_isin":
selected_categories = input[f"filter_{col}"]()
mask = mask & data[col].isin(selected_categories)
...
return mask #<< reactive returns mask, instead of dataframe
return { #<< module returns mask
"mask": get_filter_mask, #<< note it's the reactive w/out ()
}app_ui = ui.page_sidebar(
ui.sidebar(
filter_ui("module"), #<< 4. use the ui from module, same namespace
),
ui.card(
ui.card_header("Filtered Penguins Data"),
ui.output_data_frame("filtered_data"),
),
)
# Define the server logic
def server(input, output, session):
filter_module = filter_server( #<< 1. call the module
"module", #<< 2. provide namespace
data=penguins, #<< 3. pass in any module inputs
columns=penguins.columns,
)
module_filter_mask = filter_module["mask"] #<< 5. optional, explicitly extract module return
@render.data_frame
def filtered_data():
return penguins.loc[module_filter_mask()] #<< 6. use value from moduleCreate separate python modules:
helper.py: Helper function, create_ui_filtersmodule.py: Shiny moduleNow that you have separate modules, you can put them into a Python package!
from shiny import App, ui, render
from palmerpenguins import load_penguins

import module

penguins = (
    load_penguins()
    .dropna()
    .loc[:, ["species", "bill_length_mm", "body_mass_g"]]
)

app_ui = ui.page_sidebar(
    ui.sidebar(
        module.filter_ui("module"),                #<< module UI
    ),
    ui.card(
        ui.card_header("Filtered Penguins Data"),
        ui.output_data_frame("filtered_data"),
    ),
)

def server(input, output, session):
    filter_module = module.filter_server(          #<< module server
        "module",
        data=penguins,
        columns=penguins.columns,
    )

    module_filter_mask = filter_module["mask"]     #<< module return mask

    @render.data_frame
    def filtered_data():
        return penguins.loc[module_filter_mask()]  #<< use module mask

app = App(app_ui, server)So, we can…
def server(input, output, session):
    # penguins 1 data -----                          #<< rename to penguins1
    filter_module1 = module.filter_server(
        "module1",                                   #<< module1 ID
        data=penguins1,
        columns=penguins1.columns,
    )
    module_filter_mask1 = filter_module1["mask"]

    @render.data_frame
    def filtered_data1():
        return penguins1.loc[module_filter_mask1()]

    # penguins 2 data -----                          #<< call same module with penguins2
    filter_module2 = module.filter_server(
        "module2",                                   #<< module2 ID
        data=penguins2,
        columns=penguins2.columns,
    )
    module_filter_mask2 = filter_module2["mask"]

    @render.data_frame
    def filtered_data2():
return penguins2.loc[module_filter_mask2()]app_ui = ui.page_fillable( #<< fillable
ui.navset_card_tab( #<< card tab layout
ui.nav_panel(
"Penguins 1",
ui.card(
ui.layout_sidebar(
ui.sidebar(
module.filter_ui("module1"), #<< module1 UI
),
ui.output_data_frame("filtered_data1"), #<< module 1 masked data
),
),
),
ui.nav_panel(
"Penguins 2",
ui.card(
ui.layout_sidebar(
ui.sidebar(
module.filter_ui("module2"), #<<
),
ui.output_data_frame("filtered_data2"), #<<
),
),
),
),
)Daniel Chen Shiny Conf 2025
Slides, repository, demo example code: https://github.com/chendaniely/shinyconf2025-scalable_apps
Daniel Chen, Shiny Conf 2025, https://github.com/chendaniely/shinyconf2025-scalable_apps