import seaborn as sns
tips = sns.load_dataset('tips')
total_lower = tips.total_bill.min()
total_upper = tips.total_bill.max()
time_selected = tips.time.unique().tolist()
idx1 = tips.total_bill.between(
left=total_lower,
right=total_upper,
inclusive="both",
)
idx2 = tips.time.isin(time_selected)
tips_filtered = tips[idx1 & idx2]Build a dashboard
What do you see?
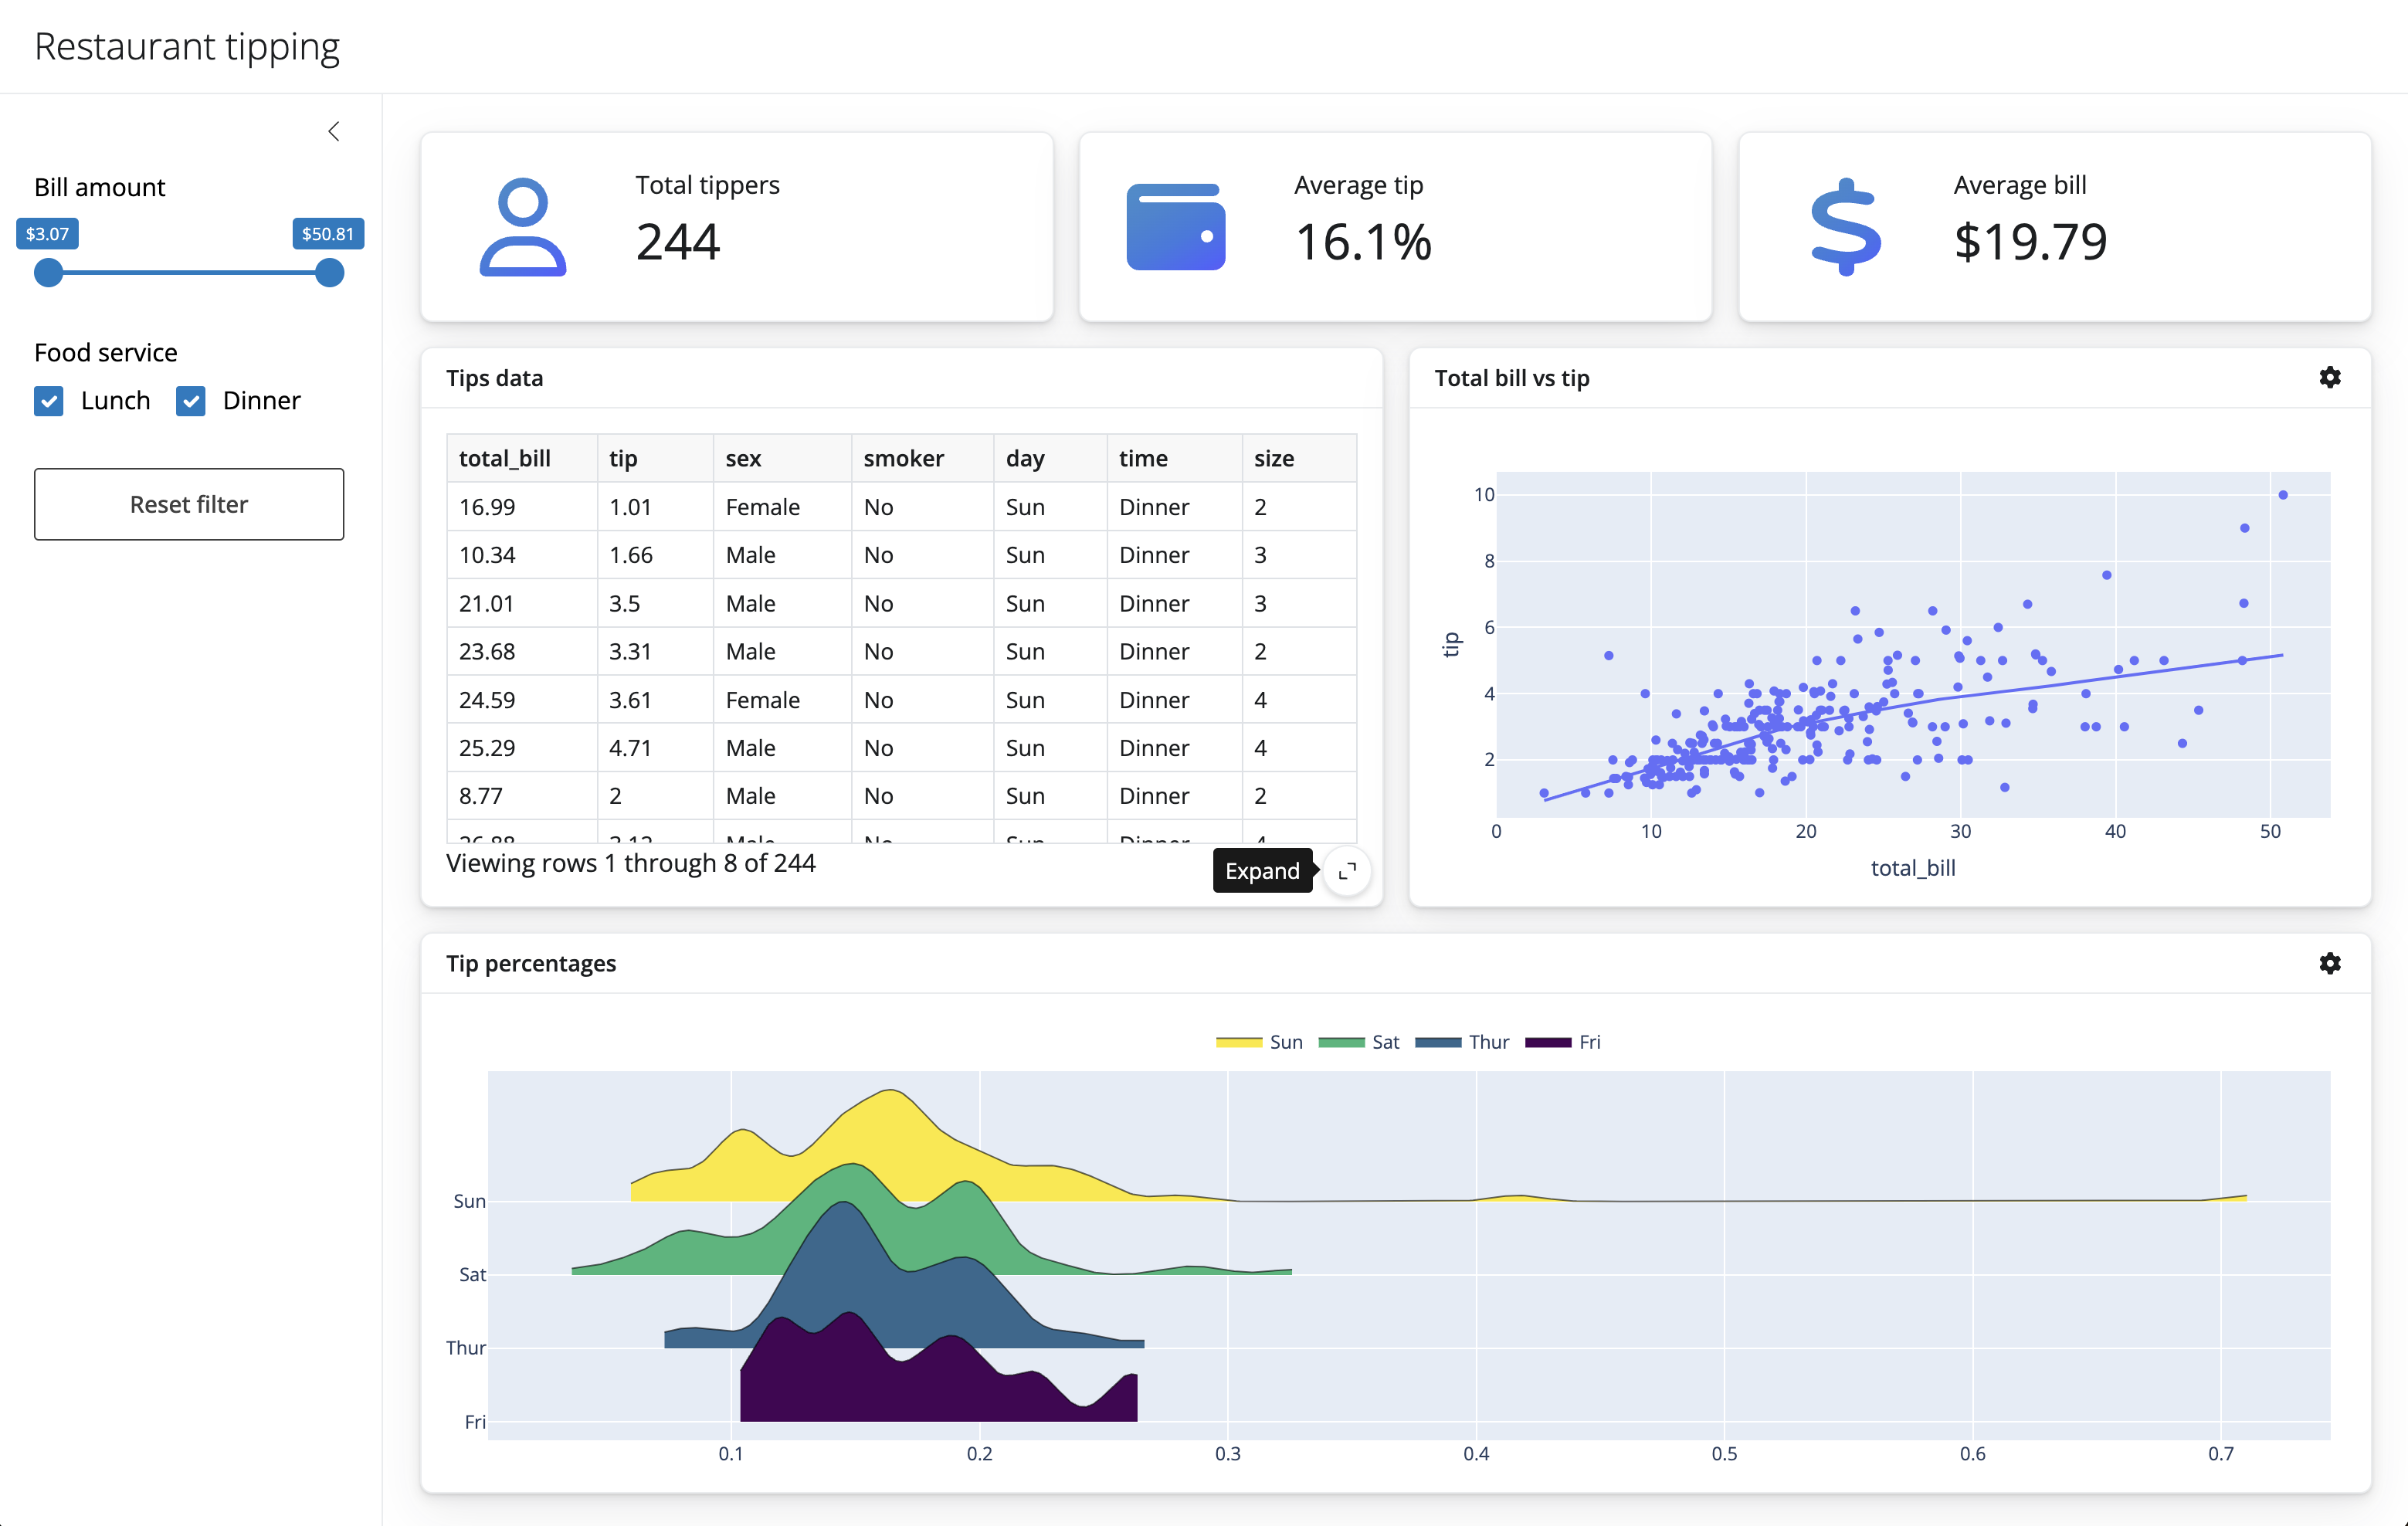
Restaurant Tipping dashboard
- Title: “Restaurant tipping”
- You can use the
ui.page_opts()and pass in atitle=''parameter
- You can use the
- Sidebar for a few input components (we’ll add those later)
- You can put some text here as a place holder, e.g.,
"sidebar inputs"
- You can put some text here as a place holder, e.g.,
- A full width column with 3 value boxes
- Each value box will take up the same width of space
- The value boxes will have separate labels and corresponding summary statistic
- A full width column with 2 cards, one for a dataframe and another for a scatter plot
- Each card will share the same width of space
- A full width column with 1 card
Your turn: App UI components
05:00
Here are the documentation pages for functions that may be useful for this exercise:
ui.page_opts(): https://shiny.posit.co/py/api/express/express.ui.page_opts.htmlui.sidebar(): https://shiny.posit.co/py/api/express/express.ui.sidebar.htmlui.layout_columns(): https://shiny.posit.co/py/api/express/express.ui.layout_columns.htmlui.card(): https://shiny.posit.co/py/api/express/express.ui.card.htmlui.card_header(): https://shiny.posit.co/py/api/express/express.ui.card_header.html
App UI
05:00
#| '!! shinylive warning !!': |
#|   shinylive does not work in self-contained HTML documents.
#|   Please set `embed-resources: false` in your metadata.
#| standalone: true
#| #| components: [editor, viewer]
#| layout: horizontal
#| viewerHeight: 500

from shiny.express import input, ui
# title
ui.page_opts(title="Restaurant tipping", fillable=True)
# sidebar (empty for now)
with ui.sidebar(open="desktop"):
    "sidebar inputs"
# body of application
# first row of value boxes
with ui.layout_columns(fill=False):
    with ui.value_box():
        "Total tippers"
        "Value 1"
    with ui.value_box():
        "Average tip"
        "Value 2"
    with ui.value_box():
        "Average bill"
        "Value 3"
# second row of cards
with ui.layout_columns(col_widths=[6, 6]):
    with ui.card(full_screen=True):
        ui.card_header("Tips data")
    with ui.card(full_screen=True):
        ui.card_header("Total bill vs tip")
with ui.layout_columns():
    with ui.card(full_screen=True):
        ui.card_header("Tip percentages")
Your turn: Add input components
02:00
#| '!! shinylive warning !!': |
#|   shinylive does not work in self-contained HTML documents.
#|   Please set `embed-resources: false` in your metadata.
#| standalone: true
#| #| components: [editor, viewer]
#| layout: horizontal
#| viewerHeight: 500

from shiny.express import input, ui
# title
ui.page_opts(title="Restaurant tipping", fillable=True)
# sidebar
with ui.sidebar(open="desktop"):
    ui.input_slider(
        id="slider",
        label="Bill amount",
        min=0,
        max=100,
        value=[0, 100],
    )
    ui.input_checkbox_group(
        id="checkbox_group",
        label="Food service",
        choices={
            "Lunch": "Lunch",
            "Dinner": "Dinner",
        },
        selected=[
            "Lunch",
            "Dinner",
        ],
    )
    ui.input_action_button("action_button", "Reset filter")
# body of application
# first row of value boxes
with ui.layout_columns(fill=False):
    with ui.value_box():
        "Total tippers"
        "Value 1"
    with ui.value_box():
        "Average tip"
        "Value 2"
    with ui.value_box():
        "Average bill"
        "Value 3"
# second row of cards
with ui.layout_columns(col_widths=[6, 6]):
    with ui.card(full_screen=True):
        ui.card_header("Tips data")
        "Tips DataFrame"
    with ui.card(full_screen=True):
        ui.card_header("Total bill vs tip")
        "Scatterplot"
with ui.layout_columns():
    with ui.card(full_screen=True):
        ui.card_header("Tip percentages")
        "ridgeplot"
Let’s add some data
Calculate values
# total tippers
total_tippers = tips_filtered.shape[0]
print(total_tippers)

# average tip
perc = tips_filtered.tip / tips_filtered.total_bill
average_tip = f"{perc.mean():.1%}"
print(average_tip)

# average bill
bill = tips_filtered.total_bill.mean()
average_bill = f"${bill:.2f}"
print(average_bill)
244
16.1%
$19.79Scatterplot
Ridgeplot
from ridgeplot import ridgeplot

tips_filtered["percent"] = tips_filtered.tip / tips_filtered.total_bill

uvals = tips_filtered.day.unique()
samples = [[tips_filtered.percent[tips_filtered.day == val]] for val in uvals]

plt = ridgeplot(
    samples=samples,
    labels=uvals,
    bandwidth=0.01,
    colorscale="viridis",
    colormode="row-index"
)

plt.update_layout(
    legend=dict(
        orientation="h",
        yanchor="bottom",
        y=1.02,
        xanchor="center",
        x=0.5
    )
)
Add reactive values to the cards
#| '!! shinylive warning !!': |
#|   shinylive does not work in self-contained HTML documents.
#|   Please set `embed-resources: false` in your metadata.
#| standalone: true
#| components: [editor, viewer]
#| layout: horizontal
#| viewerHeight: 500

import pandas as pd
import seaborn as sns
from shiny.express import input, render, ui


tips = sns.load_dataset("tips")

# title
ui.page_opts(title="Restaurant tipping", fillable=True)

# sidebar
with ui.sidebar(open="desktop"):
    ui.input_slider(
        id="slider",
        label="Bill amount",
        min=tips.total_bill.min(),
        max=tips.total_bill.max(),
        value=[tips.total_bill.min(), tips.total_bill.max()])
    ui.input_checkbox_group(
        id="checkbox_group",
        label="Food service",
        choices={
            "Lunch": "Lunch",
            "Dinner": "Dinner",
        },
        selected=[
            "Lunch",
            "Dinner",
        ],
    )
    ui.input_action_button("action_button", "Reset filter")


# body of application

# first row of value boxes
with ui.layout_columns(fill=False):
    with ui.value_box():
        "Total tippers"
        @render.text
        def total_tippers():
            idx1 = tips.total_bill.between(
                left=input.slider()[0],
                right=input.slider()[1],
                inclusive="both",
            )
            idx2 = tips.time.isin(input.checkbox_group())
            tips_filtered = tips[idx1 & idx2]

            return tips_filtered.shape[0]


    with ui.value_box():
        "Average tip"
        @render.text
        def average_tip():
            idx1 = tips.total_bill.between(
                left=input.slider()[0],
                right=input.slider()[1],
                inclusive="both",
            )
            idx2 = tips.time.isin(input.checkbox_group())
            tips_filtered = tips[idx1 & idx2]

            perc = tips_filtered.tip / tips_filtered.total_bill
            return f"{perc.mean():.1%}"

    with ui.value_box():
        "Average bill"
        @render.text
        def average_bill():
            idx1 = tips.total_bill.between(
                left=input.slider()[0],
                right=input.slider()[1],
                inclusive="both",
            )
            idx2 = tips.time.isin(input.checkbox_group())
            tips_filtered = tips[idx1 & idx2]

            bill = tips_filtered.total_bill.mean()
            return f"${bill:.2f}"
Repeated reactive calculations
Lots of repeated calculations
Shiny reactive calculations
We can use a @reactive.calc to define and save a value that reacts to inputs
#| '!! shinylive warning !!': |
#| shinylive does not work in self-contained HTML documents.
#| Please set `embed-resources: false` in your metadata.
#| standalone: true
#| components: [editor, viewer]
#| layout: horizontal
#| viewerHeight: 500
from shiny import reactive
from shiny.express import input, render, ui
ui.input_slider("x", "Slider value", min=0, max=100, value=10)
# we need to make a calculation from an input value
@render.text
def x_squared_text():
return f"Squared value: {input.x() ** 2}"
# we can save this calculation to be used later
@reactive.calc
def x_squared():
return input.x() ** 2
# we can use that saved calculation
@render.text
def x_squared_calc_text():
return f"Saved squared: {x_squared()}"Reuse reactive calculations
#| '!! shinylive warning !!': |
#| shinylive does not work in self-contained HTML documents.
#| Please set `embed-resources: false` in your metadata.
#| standalone: true
#| components: [editor, viewer]
#| layout: horizontal
#| viewerHeight: 500
from shiny import reactive
from shiny.express import input, render, ui
ui.input_slider("x", "Slider value", min=0, max=100, value=10)
# we need to make a calculation from an input value
@render.text
def x_squared_text():
return f"Squared value: {input.x() ** 2}"
# we can save this calculation to be used later
@reactive.calc
def x_squared():
return input.x() ** 2
# we can use that saved calculation
@render.text
def x_squared_calc_text():
return f"Saved squared: {x_squared()}"
# we can build on top of that saved calculation
@render.text
def x_squared_half_calc_text():
return f"Build on squared value: {x_squared() / 2}"
# we don't need to re-calculate everything from the input again
@render.text
def x_squared_half_text():
return f"Recalculate from input: {input.x() ** 2 / 2}"Your turn: Filtered tips reactive.calc
05:00
#| '!! shinylive warning !!': |
#| shinylive does not work in self-contained HTML documents.
#| Please set `embed-resources: false` in your metadata.
#| standalone: true
#| components: [editor, viewer]
#| layout: horizontal
#| viewerHeight: 500
import pandas as pd
import seaborn as sns
from shiny.express import input, render, ui
tips = sns.load_dataset("tips")
# title
ui.page_opts(title="Restaurant tipping", fillable=True)
# sidebar
with ui.sidebar(open="desktop"):
ui.input_slider(
id="slider",
label="Bill amount",
min=tips.total_bill.min(),
max=tips.total_bill.max(),
value=[tips.total_bill.min(), tips.total_bill.max()])
ui.input_checkbox_group(
id="checkbox_group",
label="Food service",
choices={
"Lunch": "Lunch",
"Dinner": "Dinner",
},
selected=[
"Lunch",
"Dinner",
],
)
ui.input_action_button("action_button", "Reset filter")
# body of application
# first row of value boxes
with ui.layout_columns(fill=False):
with ui.value_box():
"Total tippers"
@render.text
def total_tippers():
idx1 = tips.total_bill.between(
    left=input.slider()[0],
    right=input.slider()[1],
    inclusive="both",
)
idx2 = tips.time.isin(input.checkbox_group())
tips_filtered = tips[idx1 & idx2]
tips_filtered.shape[0]The application
05:00
#| '!! shinylive warning !!': |
#|   shinylive does not work in self-contained HTML documents.
#|   Please set `embed-resources: false` in your metadata.
#| standalone: true
#| #| components: [editor, viewer]
#| layout: horizontal
#| viewerHeight: 500


import plotly.express as px
from ridgeplot import ridgeplot
import seaborn as sns
from shiny.express import input, ui, render
from shiny import reactive
from shinywidgets import render_plotly, render_widget

tips = sns.load_dataset("tips")

# title
ui.page_opts(title="Restaurant tipping", fillable=True)

# sidebar
with ui.sidebar(open="desktop"):
    ui.input_slider(
        id="slider",
        label="Bill amount",
        min=tips.total_bill.min(),
        max=tips.total_bill.max(),
        value=[tips.total_bill.min(), tips.total_bill.max()])
    ui.input_checkbox_group(
        id="checkbox_group",
        label="Food service",
        choices={
            "Lunch": "Lunch",
            "Dinner": "Dinner",
        },
        selected=[
            "Lunch",
            "Dinner",
        ],
    )
    ui.input_action_button("action_button", "Reset filter")

@reactive.calc
def filtered_data():
    idx1 = tips.total_bill.between(
                left=input.slider()[0],
                right=input.slider()[1],
                inclusive="both",
            )
    idx2 = tips.time.isin(input.checkbox_group())
    tips_filtered = tips[idx1 & idx2]
    return tips_filtered


# body of application
# first row of value boxes
with ui.layout_columns(fill=False):
    with ui.value_box():
        "Total tippers"
        @render.text
        def total_tippers():
            return filtered_data().shape[0]


    with ui.value_box():
        "Average tip"
        @render.text
        def average_tip():
            perc = filtered_data().tip / filtered_data().total_bill
            return f"{perc.mean():.1%}"

    with ui.value_box():
        "Average bill"
        @render.text
        def average_bill():
            bill = filtered_data().total_bill.mean()
            return f"${bill:.2f}"

# second row of cards
with ui.layout_columns(col_widths=[6, 6]):
    with ui.card(full_screen=True):
        ui.card_header("Tips data")
        @render.data_frame
        def tips_data():
            return filtered_data()

    with ui.card(full_screen=True):
        ui.card_header("Total bill vs tip")
        @render_plotly
        def scatterplot():
            return px.scatter(
                filtered_data(),
                x="total_bill",
                y="tip",
                trendline="lowess"
            )


with ui.layout_columns():
    with ui.card(full_screen=True):
        ui.card_header("Tip percentages")
        @render_widget
        def ridge():
            filtered_data()["percent"] = filtered_data().tip / filtered_data().total_bill

            uvals = filtered_data().day.unique()
            samples = [[filtered_data().percent[filtered_data().day == val]] for val in uvals]

            plt = ridgeplot(
                samples=samples,
                labels=uvals,
                bandwidth=0.01,
                colorscale="viridis",
                colormode="row-index"
            )

            plt.update_layout(
                legend=dict(
                    orientation="h",
                    yanchor="bottom",
                    y=1.02,
                    xanchor="center",
                    x=0.5
                )
            )

            return plt
Challenge: Button
- Reactive events
https://shiny.posit.co/py/api/express/express.ui.input_action_button.html
SciPy 2025. https://github.com/chendaniely/scipy-2025-shiny