
Your First Application
Development approach
Start static, then add interactivity.
- Write the visualization you want
- Identify what the user should be able to change
- Wrap inputs around those variables
- Connect inputs to outputs
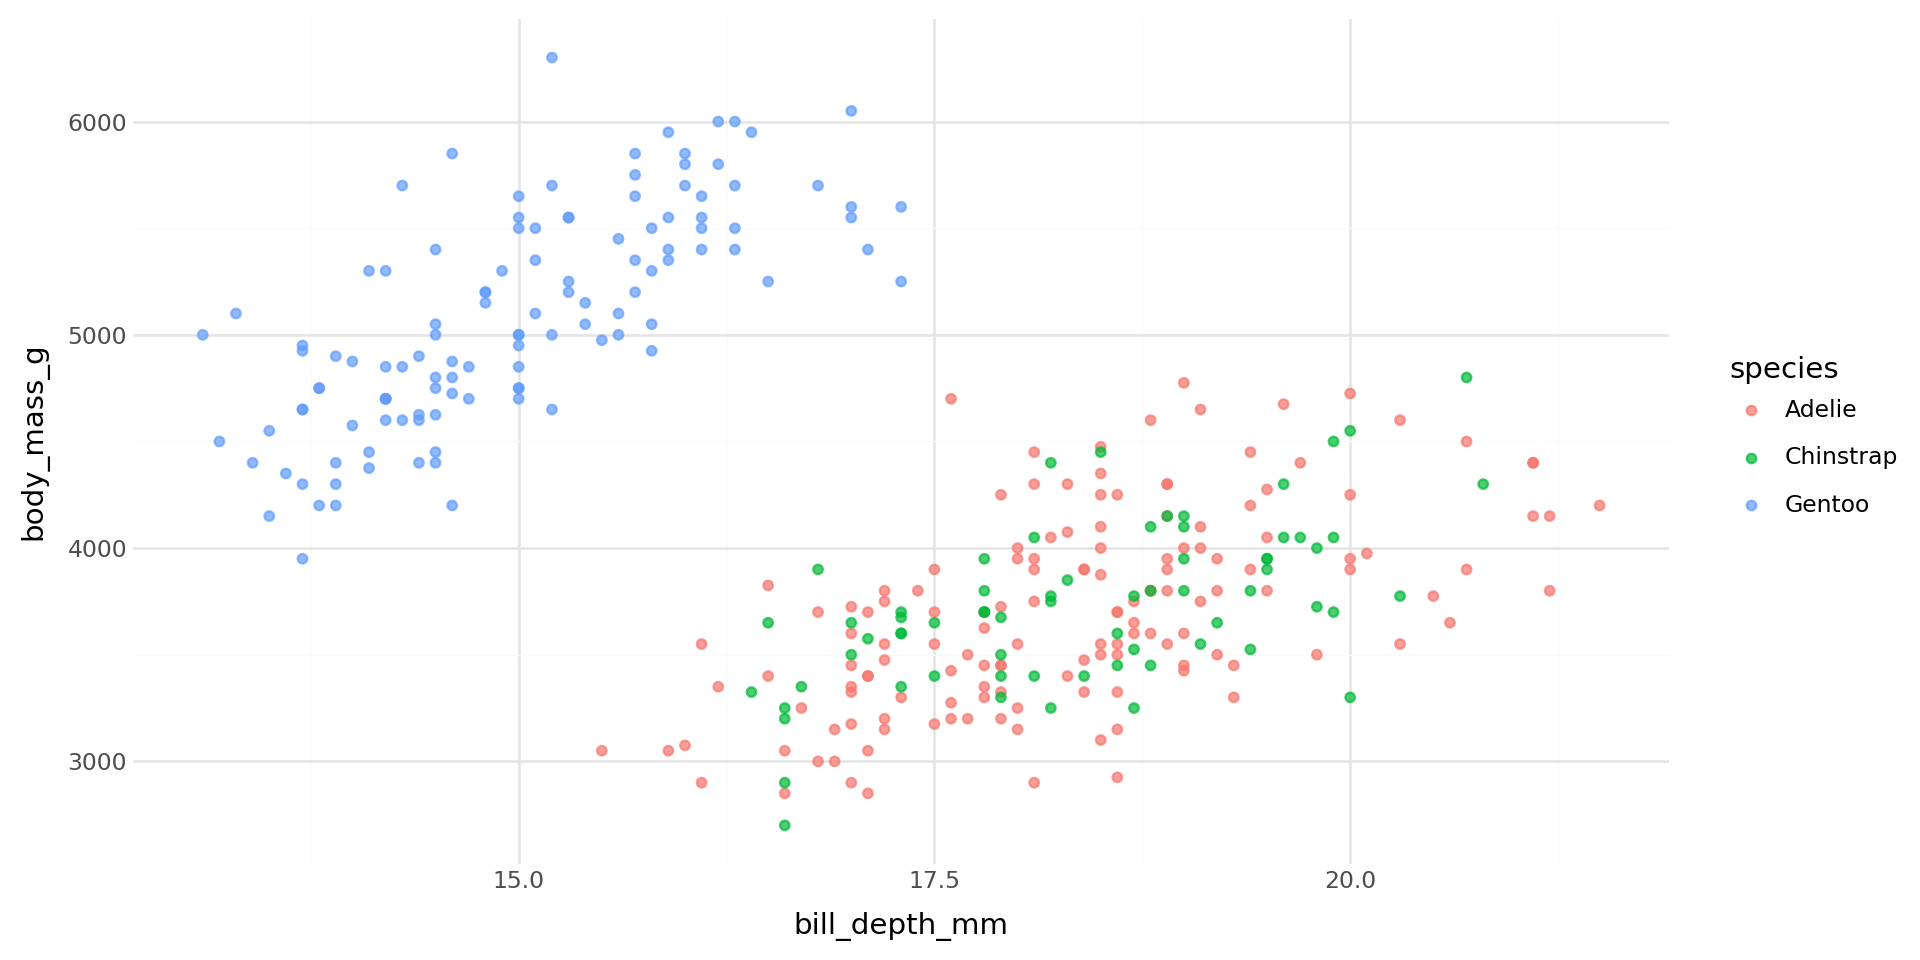
Step 1 — static plot
Step 1b - parameterize your output
Step 2 — add Shiny imports
from palmerpenguins import load_penguins
from plotnine import aes, geom_point, ggplot, theme_minimal
1from shiny.express import input, render, ui

dat = load_penguins().dropna()- 1
-
Import
input,render, anduifromshiny.express
Step 3 — discover the axis choices
from palmerpenguins import load_penguins
from plotnine import aes, geom_point, ggplot, theme_minimal
from shiny.express import input, render, ui

dat = load_penguins().dropna()
1num_cols = dat.select_dtypes("float64").columns.tolist()- 1
- Automatically finds all numeric columns — no hard-coded list needed
You can still use your normal Python skills!
Step 4 — add inputs
#| '!! shinylive warning !!': |
#|   shinylive does not work in self-contained HTML documents.
#|   Please set `embed-resources: false` in your metadata.
#| standalone: true
#| components: [editor, viewer]
from palmerpenguins import load_penguins
from plotnine import aes, geom_point, ggplot, theme_minimal
from shiny.express import input, render, ui

dat = load_penguins().dropna()
num_cols = dat.select_dtypes("float64").columns.tolist()

ui.input_select("x", "", num_cols, selected="bill_depth_mm")
ui.input_select("y", "", num_cols, selected="body_mass_g")- Dropdown for the X axis — input ID is
"x" - Dropdown for the Y axis — input ID is
"y"
Step 5 — make the output reactive
#| '!! shinylive warning !!': |
#|   shinylive does not work in self-contained HTML documents.
#|   Please set `embed-resources: false` in your metadata.
#| standalone: true
#| components: [editor, viewer]
from palmerpenguins import load_penguins
from plotnine import aes, geom_point, ggplot, theme_minimal
from shiny.express import input, render, ui

dat = load_penguins().dropna()
num_cols = dat.select_dtypes("float64").columns.tolist()

ui.input_select("x", "", num_cols, selected="bill_depth_mm")
ui.input_select("y", "", num_cols, selected="body_mass_g")


@render.plot
def plot():
    return (
        ggplot(dat, aes(x=input.x(), y=input.y(), color="species"))
        + geom_point(alpha=0.7)
        + theme_minimal()
)@render.plottells Shiny this function produces a plotinput.x()andinput.y()read the current dropdown selections
What just happened?
input.x()andinput.y()are reactive values — they change when the user picksinput.*()- signals reading from an input component
@render.plotcreates a reactive context — it re-runs whenever its inputs change@render*- signals an output component
- Both dropdowns drive the same output with no extra wiring
Shiny tracked both dependencies automatically.
Important
Reactive behaviors must stay within a reactive context.
- We will talk about
@reactive.*()values for reactive intermediates
Output without reactive context
#| '!! shinylive warning !!': |
#|   shinylive does not work in self-contained HTML documents.
#|   Please set `embed-resources: false` in your metadata.
#| standalone: true
#| components: [editor, viewer]
from palmerpenguins import load_penguins
from plotnine import aes, geom_point, ggplot, theme_minimal
from shiny.express import input, render, ui

dat = load_penguins().dropna()
num_cols = dat.select_dtypes("float64").columns.tolist()

ui.input_select("x", "", num_cols, selected="bill_depth_mm")
ui.input_select("y", "", num_cols, selected="body_mass_g")


(
    ggplot(dat, aes(x=input.x(), y=input.y(), color="species"))
    + geom_point(alpha=0.7)
    + theme_minimal()
)
The complete app
#| '!! shinylive warning !!': |
#|   shinylive does not work in self-contained HTML documents.
#|   Please set `embed-resources: false` in your metadata.
#| standalone: true
#| components: [editor, viewer]

from palmerpenguins import load_penguins
from plotnine import aes, geom_point, ggplot, theme_minimal
from shiny.express import input, render, ui

dat = load_penguins().dropna()
num_cols = dat.select_dtypes("float64").columns.tolist()

ui.input_select("x", "", num_cols, selected="bill_depth_mm")
ui.input_select("y", "", num_cols, selected="body_mass_g")


@render.plot
def plot():
    return (ggplot(dat, aes(x=input.x(), y=input.y(), color="species")) +
        geom_point(alpha=0.7) +
        theme_minimal()
)![]()
PyCon US 2026. chendaniely/pycon-2026-shiny